Map: 36,144 refugees admitted to US in first seven months of FY2015 (fiscal year)
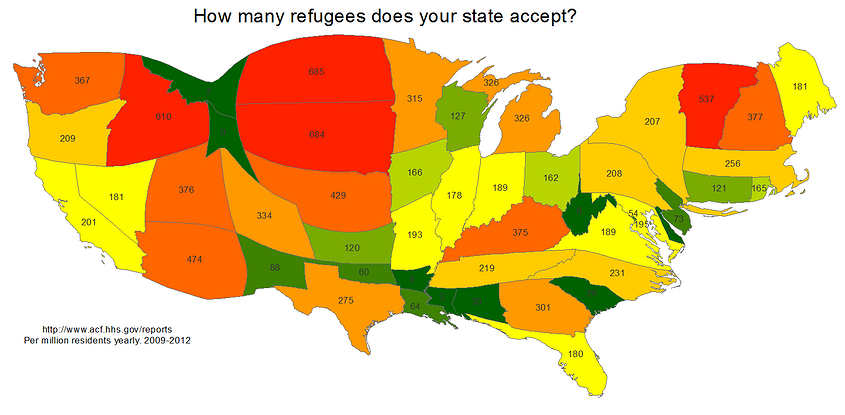
Look at this cool map I found for how many refugees were resettled in your state relative to your population: “This map by Casey Cupp is warped to show which states take on the highest number of refugees relative to their population. For example, the densely populated New Jersey takes in a far lower rate of refugees than that of the two Dakotas. What the map shows is that the distribution of refugees looks very different when considering state populations as opposed to strictly the number of people living in each state.” http://www.humanosphere.org/basics/2014/02/map-day-refugees-accepted-us-states-population-adjusted/
I was just having a look at the statistics for FY2015 maintained by the US State Department on refugee admissions (I was checking out Malta), but thought you might like to know which groups we are admitting (welcoming!) in the largest numbers.
The total number of refugees admitted so far in FY2015 (which ends on September 30th) is 36,144 from 80 countries. (Making sure we get lots and lots of diversity for your school systems to cope with!)
Here are the top ten in descending order:
Burma (9,040)
Iraq (8,229)
Somalia (4,993)
DR Congo (2,921)
Bhutan/Nepal (2,849)
Iran (1,474)
Cuba (1,093)
Ukraine (831)
Eritrea (801)
Syria (651)
Tip for using the data base: Do not use the map for “processing country” because that tells you nothing about who we actually admitted. For example, you will see that Kenya (on the processing country map) is listed as 1,537. That does not mean that we admitted 1,537 Kenyans (we don’t take Kenyans as refugees, unless they are Obama relatives). It means that 1,537 were processed in Kenya and those most likely are Somalis from the UN camps located in Kenya.
States which received over 1000 refugees in the last seven months (in descending order):
Texas (3,865)
California (2,974)
New York (2,008)
Michigan (1,696)
Arizona (1,667)
Ohio (1,591)
Washington (1,464)
Georgia (1,410)
Pennsylvania (1,384)
Illinois (1,383)
Florida (1,381)
Minnesota (1,250) 562 of those are new Somalis!
North Caroina (1,211)
For future reference, this post is archived in our ‘where to find information’ category and in our ‘refugee statistics’ category.
For wannabe researchers, this data base (where I got the above numbers) is only for the present fiscal year. To go to a more extensive data base going back to 2002, go here.