Reference
Reference, facts and research
Welcome to the CAIRCO reference section. You can click on each item to view additional information. Some items contain subsections. You can "drill down" to read each subsection, then go back up to the main list when you are finished.
Reference:
Quick facts on population and immigration
Here are quick facts on mass immigration and population growth in the United States. (Updated 2007).
The Census Bureau projects that U.S. population will double this century, practically within the lifetimes of children born today. 70% of this doubling will be due to mass immigration - that is, due to new immigrants and their descendents.
Colorado currently has 4.3 million residents and is the third-fastest growing state in the U.S. Colorado is suffering from overcrowded schools, and traffic, congestion, smog, and sprawl. Every hour, ten acres of our farmland and open space are lost to development.
- Immigration from 1925 to 1965 averaged 178,000 per year. Now, we're taking in approximately 1.1 million legal immigrants and up to 700,000 illegal aliens annually3.
- Under current policy, U.S. population will double this century - practically within the lifetimes of today's children - and will continue to grow2.
- In 1995, only 5% of legal immigrants were skilled workers.
- 72% of Black Americans want immigration reduction.
- 1.3 million acres, an area the size of Delaware, are being black topped each year.
- Immigration made sense when we were an empty continent, not now when the ecological carrying capacity of the U.S. is being stretch to its limit5.
-
Immigrants accounted for more than 45 percent of the growth in Colorado's population in the past two years1. An estimated 33.1 million immigrants now live in the United States, about 11.5 percent of the total population, according to the report's figures, based on still-unreleased U.S. Census Bureau data collected in March 20022.
In Colorado, the number of immigrants has grown from 8.6 percent of the population two years ago to just under 10 percent now. Of the 165,000 residents new to Colorado between April 2000 and March 2002, 75,000 were born outside the United States, according to Center for Immigration Studies7.
Almost 52 percent of immigrant families earn less than two times the official poverty level, while that rate among U.S.-born households is 21.6 percent. Nearly 20 percent of immigrant-headed households in Colorado receive some form of welfare benefit.6 -
A new report by the Center for Immigration Studies concludes that over 33 million legal immigrants and illegal aliens now live in the United States, an increase of 2 million immigrants since the recent April 2000 Census7. How significant is an increate of 33 million people?
- 33 million is larger than the current population of Canada.
- 33 million is the combined populations of the 20 largest cities in the U.S in 2000, according to the U.S. Census Bureau: New York City, Los Angeles, Chicago, Houston, Philadelphia, Phoenix, San Diego, Dallas, San Antonio, Detroit, San Jose, Indianapolis, San Francisco, Jacksonville, Columbus, Austin, Baltimore, Memphis, and Milwaukee.
- 33 million people in the U.S. would require over 12 million housing units8, would require 15.8 million more passenger cars9, and would consume about 825 million barrels of oil a year (25 barrels per person per year). 33 million Americans will consume all of the economically recoverable oil in the Arctic National Wildlife Refuge (ANWR) in less than four years time.10
- 33 million people can be expected to consume 2.26 billion cubic feet of roundwood per year (80 cubic feet per person). Over 75 million acres of forest will be needed to supply 33 million people with their paper and wood needs.11
- Post 1970 immigrants and their descendants have added more than 55 million people to our country; this is the equivalent of absorbing all of Central America in thirty years. Yet Central America's, Mexico's, and China's populations have grown even larger. Clearly, we are not able to address the world's problems by attempting to absorb their excess population.
- The Population Reference Bureau projects the U.S. will add 140 million people to it population between 2002 and 2050, thus increasing the population of the U.S from 287 million to 420 million12.
- In 2002, the fertility rate of the U.S. was higher than that of 70 other countries, "including less developed China, Korea and Thailand." Indeed, four other less developed countries also have a fertility rate lower than that of the U.S.: Iran, Cuba, Singapore, and Sri Lanka.
- Former U.S. Census Bureau demographer Jeffrey Passel (now with the Urban Institute) issued a conservative estimate there are "at least 8.5 million undocumented foreigners in the United States." This means that the population of illegal aliens in the U.S. is larger than the population of any one of the following 41 states: Georgia, North Carolina, Virginia, Massachusetts, Indiana, Washington, Tennessee, Missouri, Wisconsin, Maryland, Arizona, Minnesota, Louisiana, Alabama, Colorado, Kentucky, South Carolina, Oklahoma, Oregon, Connecticut, Iowa, Mississippi, Kansas, Arkansas, Utah, Nevada, New Mexico, West Virginia, Nebraska, Idaho, Maine, New Hampshire, Hawaii, Rhode Island, Montana, Delaware, South Dakota, North Dakota, Alaska, Vermont, or Wyoming.
- About 70 percent of the foreign-born population in the U.S. in 2000 entered the U.S. after 1980, and more than 40 percent entered the U.S. after 1990. The Select Commission on Immigration and Refugee Policy discussed in 1980 implementing a cap on immigrant admissions of 425,000 per year. In 1982 the "Bumpers Amendment" to cap legal immigrant admissions at this level was nearly passed by the U.S. Senate.13 Yet it did not pass, in good part because some senators believed the numbers to be still too high and opposed amnesties for illegal aliens. In 1986, however, an amnesty did pass with no cap on legal immigrant admissions. Today legal immigration alone into the U.S. is running at over twice the level called for in the above-mentioned "Bumpers Amendment".
- Approximately one out of five babies born in the U.S. in 2000 had a foreign-born mother.
More quick facts
Population growth
- U.S. population will double this century, within the lifetimes of children born today. Leaving such a legacy has been described as a hate crime against future generations.
- Colorado's State demographer projects Colorado's population to surge to 7 million by 2030. 60,000 will arrive each year, most moving to the Front Range. The fastest-growing areas include the Western Slope and weld County. (Denver Post article, June 19, 2003).
- Over past 50 years, Colorado's population has tripled in size. In 1950, Colorado had 1.3 million people. In 1980, Colorado;s population was approaching 3 million. Then we added 1 million, about 275 people per day. We now have 4.3 million in 2003.
- Colorado grew 30% in the 1990's - the third fastest-growing state in the U.S., home to 5 of the nation's 10 fastest-growing counties. Metro Denver grew from 2 million to over 2.4 million in the 1990's.
- In the 1990's, natural increase (births minus deaths) accounted for 38% of growth, half of growth was from migration from other states, and remainder was due to secondary migration from other countries. 25% of migration into Colorado in the 1990's came from California. Colorado is Projected to add 1 million people next 10-20 years. (Denver Post article, June 19, 2003).
Schools
- Colorado K-12 enrolment grew by 29% in the 1990's. Colorado's elementary and high school enrollment increased 32% in the 1990's. In the next 10 years, number of students could increase by 100,000 from 790,000 in 2000. We could easily surpass one million students by 2025.
- Colorado spends $50 million per year educating immigrant children from Mexico alone. This will require 5,000 new teachers to be hired annually and building 20 new schools annually. The Rocky Mountain News reported construction and renovation would cost $165-175 million.
- State has proposed $500 million in additional funding for rural schools in the southern part of the state. The number of Spanish-speaking only students has increase five-fold in the past 5 years.Non-English speaking students statewide nearly doubled to 16,715 from 1992-1996, and accounted for nearly all enrolment growth in Aurora, Commerce City, Lamar, 74% of the increase in Denver, and 40%-60% of the increase in Leadville and West Yuma.
Traffic
- 11% of Colorado workers travel more than 40 minutes to work. The commute time likely double by 2025. Denver ranks 5th in the nation for time lost in traffic - estimated at 35 hours per year per commuter. Total cost for this wasted time and fuel is estimated at $1.4 billion each year.
- The Denver Regional Council of Governments (DRCOG) projects a need for 2,300 lane-miles over the next 20 years to prevent congestion. Yet their long-range plan accounts for only half of that required growth.
Water
- Governor's Commission on Saving Open Spaces, Farms, and Ranches found : "Rapid growth, inadequate water supply and extremely dry conditions have left cities thirsty for more water."
- In 2002 Colorado water shortages forced farmers to cut crop yields by 50% and liquidate 70% of their cattle herds.
- A June 21, 2003 Rocky Mountain News article, Do or dry for mountain towns, stated: "During next 30 years, nearly two dozen fast-growing communities in Summit and Grand counties will face water shortages as Front Range cities siphon off larger and larger amounts to quench their thirsts..." "This about allocating the last drop", said Dan Luecke, a water expert.
- "Grand County will quadruple in next 30 to 50 years." And "In Summit County, water use is expected to more than double.
- Colorado may need up to 500,000 new acre-feet of new water within the next 30 years.
U.S. Immigration
- Over 1 million legal immigrants, and approximately 700,000 illegal aliens enter into the U.S. each year. That's 80,000 illegal aliens per month. Currently 9 to 11 million illegal aliens in U.S., double 1994 level.
- Illegal alien population in the U.S. is larger than the populations of any one of a list of 41 U.S. states.
- A quarter-million illegal aliens from Middle-East countries currently live in the U.S., many now entering across the Arizona-Mexico border.
- Colorado ranks 11th in illegal migration, with over 45,000 illegal aliens residing in Colorado in 1996.
- Historically, 178,000 legal per year migrated to the U.S., between 1925-1965. An average of 230,000 legal immigrants per year migrated here between 1776-1976.
- California has practically doubled in population in the last 35 years. 96% of its growth in the 1990's was due to immigration. California now has 35 million, and is larger than most countries of the world.
- A recent Center for Immigration studies report shows 33 million legal immigrants and illegal aliens now reside in the U.S. This 33 million is larger than the entire population of Canada. This 33 million is equal to the combined populations of the 20 largest cities in the U.S.
- Post 1970 immigrants and their descendents have added more than 55 million people to our country - equivalent to absorbing all of Central America, excluding Mexico, in 30 years.
- Colorado's immigrant stock (immigrants and their descendents) was 19.6% in 1997 - the 13th highest in the country.
- Colorado's foreign-born increased 160% during the 1990's.
Economic costs
- 40-50% of wage loss among low-skilled Americans is due to immigration of low-skilled workers.
- 1,880,000 American workers are displaced from their jobs by immigration. The cost for providing welfare and assistance to displaced Americans is over $15 billion/year.
- The net annual cost of immigration is between $67 and $87 per year.
- The National Academy of Sciences found the net fiscal drain on American taxpayers is $166-226 per year for each native household. Even studies showing modest economic gain from immigration ($1-10 billion per year) find it is outweighed by the fiscal cost of $15-20 billion per year.
- Approximately 52% of immigrant families earn less than two times the officil poverty level. Nearly 20% of immigrant-headed households in Colorado receive some form of welfare benefit.
Ski resorts
- As many as 7,000 illegal aliens work at Colorado ski resorts. In Summit County, approximately 10% are foreign-born.
Drugs
- 80% of cocaine and 50% of heroin in the U.S. are smuggled across the border by Mexican nationals.
- Drug cartels spend a half-billion dollars per year bribing corrupt Mexican army and police officials.
Hospitals
- Dozens of hospitals in Texas, New Mexico, Arizona, and California have been forced to close or face bankruptcy because of providing coverage to illegal aliens.
Anchor babies
- There are 287,000-363,000 children born to illegal aliens each year.
- In 1994, California paid for 74,987 deliveries to illegal alien mothers at a total cost of $215.2 million.
- Illegal alien mothers accounted for 36% of all Medi-Cal funded births in California in 1994.
- Losses are approximately $79 million in California, $74 million in Texas, $31 million in Arizona, and $6 million in New Mexico.
- In Colorado, Medicaid paid approximately $30 million in costs for approximately 6,000 illegal alien mothers, 40% of all births paid for by Medicaid in Colorado. These 6,000 anchor babies immediately became U.S. citizens and qualified for full Medicaid services, with a cost yet to be determined.
Prisons
- Taxpayers pay half a billion dollars per year incarcerating illegal alien criminals. This costs Colorado taxpayers approximately $14 million annually.
Transfer of wealth
- $60 billion earned by illegal aliens in the U.S. each year.
- $10 billion are sent back to Mexico annually, equal to the amount Mexico earns from tourism.
Sprawl
- Denver has the fourth worst sprawl in the nation, according to Fannie Mae Foundation.
- Housing costs for the elderly have increase to more than 50% of their average income.
- Colorado workers who make minimum wage must work 124 hours per week in order to afford a two-bedroom apartment.
- Approximately 1 acre of open land is lost through urbanization and degradation for each person added to the U.S. - about 3 million people and therefore 3 million acres lost each year.
- Yet many experts agree on a sustainable population of 150 million in the U.S.
- In Colorado, every hour, 10 acres of farmland and open space are lost to development.
- Colorado's population density rose from 32 people per square mile in 1990 to 41 people per square mile in 2000, a 28% increase.
- Each year, Colorado loses 22,500 acres of open space and farmland tue to development.
- Colorado has the 2nd largest growth in housing development in the nation.
Nations originally controlling the western United States
- In the Adams-Onis Treaty of 1819, the U.S. ceded to Spain the possession of Texas, California and New Mexico (lands included present-day Nevada, Utah, Arizona parts of Wyoming and Colorado). Other territories, including the Oregon territory, were ceded to the U.S. by Spain.
- Mexico was not an independent nation until 1821.
- By 1836 the Republic of Texas had established itself separate from Mexico and by 1846 Mexican control of California was in considerable question. Except (arguably) for the Civil War, Texas has been part of the United States since 1846.
- In the 1848 Treaty of Guadalupe Hidalgo, the U.S. paid Mexico approximately $20 million for all of present-day California, Nevada, and Utah, and parts of present-day Arisona, Colorado, New Mexico and Wyoming. The nation of Mexico by then had officially controlled California and the mentioned territories for less than thirty years.
- Los Angeles was named by Father Juan Crespi, a Spanish Franciscan priest and missionary who was born in Palma. He hailed from Europe.
- San Antonio was named "San Antonio de Padua" by Spaniard Domingo Teran de los Rios in 1691. Teran, remembered today as the first provincial governor of Texas, was a member of the Spanish military who previously had spent twenty years in Spanish service in Peru.
- San Francisco was named by Portuguese explorer Sebastian Rodriguez Cermeno, who claimed it for Spain.
References
1. Population Environment Balance
2. U.S. Census Bureau.
3. NumbersUSA.com, and Center for Immigration Studies.
4. SUSPS data and numbers.
5. EcoFuture Ecological Footprint references.
6. Immigrants account for 45% of Colorados growth, by Michael Riley, The Denver Post, November 27, 2002.
7. Immigrants in the United States - 2002 - A Snapshot of America's Foreign-Born Population, by Steven A. Camarota, Center for Immigration Studies, November, 2002.
8. The Impact of Immigration on U.S. Population Growth, Steven Camarota, Center for Immigration Studies, Testimony prepared for the U.S. House of Representatives, Committee on the Judiciary Subcommittee on Immigration, Border Security, and Claims, August 2,2001.
9. Population and Natural Resources, American Association for the Advancement of Science, 2000.
10. Drilling For Oil in the Arctic National Wildlife Refuge Won't Address National Security or Consumer Needs, Sierra Club; and U.S. Per-Capita Use of Petroleum Energy Information Administration, Annual Energy Review 1997, DOE/EIA.
11. Indicator 29 - Value and volume of wood and wood products production, including value added through downstream, 2003 National Report on Sustainable Forest Management, USDA Forest Service; and Indicator 31 - Supply and consumption of wood and wood products, including consumption per capita, 2003 National Report on Sustainable Forest Management, USDA Forest Service.
12. What Drives U.S. Population Growth?, Population Reference Bureau, December, 2002.
13. 97th Congress State Record Vote Analysis, 1982.
287(g) program
The 287(g) program has been a highly successful program where state and local law enforcement agencies worked with ICE to enforce existing US immigration law. Section 287(g) of the Immigration and Nationality Act (INA) provides framework for state and local enforcement to investigate, detain, and arrest illegal aliens on criminal and civil grounds.
Yet the Obama administration, as part of its "administrative amnesty program", directed ICE not to renew 287(g) contracts in 2013.
From ICE on 287(g):
U.S. Immigration and Customs Enforcement (ICE), the largest investigative agency in the Department of Homeland Security, enforces federal immigration laws as part of its homeland security mission. ICE works closely with federal, state and local law enforcement partners in this mission.
The 287(g) program, one of ICE’s top partnership initiatives, allows a state and local law enforcement entity to enter into a partnership with ICE, under a joint Memorandum of Agreement (MOA). The state or local entity receives delegated authority for immigration enforcement within their jurisdictions.
Section 287(g) Is the Right Answer for State and Local Immigration Enforcement, Heritage Foundation, March 6, 2006
Any comprehensive border and immigration security legislation by Congress should include provisions for strengthening and expanding programs authorized under §287(g)...
The 287(g) Program: Protecting Home Towns and Homeland, Center for Immigration Studies, October, 2009
... the Obama administration, in a move consistent with other recent steps to scale back immigration law enforcement, recently announced its intent to impose new rules for the 287(g) program that unduly constrain the local partners and could allow too many alien scofflaws identified by local agencies to remain here. But even with these changes... the 287(g) program still remains an effective tool in immigration law enforcement and local crime-fighting...
About 1,000 officers from 67 law enforcement agencies have been trained and participate in the program. With 9 new agencies joining and a handful of agencies dropping out in 2009, the total number of participating agencies as of October 2009 is 73.
287(g) officers lodged immigration charges on more than 81,000 illegal or criminal aliens between January 2006 and November 2008, according to data provided to us by ICE...
Obama’s Administrative Amnesty, FAIR, February 14, 2014
On February 13, 2012, President Obama introduced his 2013 budget, proposing to slash immigration enforcement programs. In addition to cutting funding for U.S. Immigration and Customs Enforcement (ICE) by 4 percent, the White House proposal sought reducing the 287(g) federal-local law enforcement program by $17 million—a whopping 25 percent.
Despite Congress refusing to enact President Obama’s budget, he nonetheless got his way when buried in the bottom of an ICE press release ten months later, his Administration declared it would not be renewing any 287(g) task force model agreements in 2013. The release stated, “ICE has... decided not to renew any of its agreements with state and local law enforcement agencies that operate task forces under the 287(g) program.” In effect, Obama’s move was more significant than the $17 million cut initially sought, effectively cutting the state and local law enforcement program in half.
Despite the effectiveness and popularity of the 287(g) program, the Obama Administration has from the beginning been working to dismantle it. Just months after taking office, President Obama restricted the 287(g) program to ensure participating law enforcement agencies enforced immigration laws only against “dangerous criminal aliens.”
President Obama’s Record of Dismantling Immigration Enforcement, FAIR (read the full report)
...A review of the Obama Administration's record shows:
The Administration's conscious effort to end policies that effectively enforce and deter illegal immigration. This includes the cessation of meaningful worksite enforcement against employers who hire illegal aliens and the removal of the illegal workers. It also includes ending effective partnership programs with state and local governments, such as the 287(g) program, that provide a structure through which state and local agencies may enforce immigration laws...
Anti-Defamation League Politics
Anti-Defamation League Politics
The following is primarily a compilation of article excerpts relating to the political nature of the Anti-Defamation League. Focus is on ADL's politics and propaganda, its unpopularity with much of the Jewish community, and, in particular, its disturbing penetration of many U.S. public school systems. Many NGOs and parent groups are heavily engaged in opposing ongoing political indoctrination of K-12 public school students. This is imposed via a variety of Critical Race Theory-promoting or CRT-derived initiatives. The ADL's "No Place for Hate" program is just one of these and used in about 1800 school systems in the U.S.
Below we include just the introduction to the compilation. Here is the entire 35-page document:
Anti-Defamation League: A Compilation of Information on Its Political Nature, Stuart H. Hurlbert, Professor of Biology Emeritus, San Diego State University, CAIRCO Report, June 2022
INTRODUCTION
The Anti-Defamation League has inserted itself into American politics in variety of ways over the decades primarily in the guise of a non-partisan, civil rights organization. Currently it has been allowed to have great influence nationally on bullying, diversity, equity and inclusivity issues in K-12 education systems in particular. This note does not analyze ADL in depth but only critiques specific sections of the NPFH Handbook and provides excerpts from 106 linked articles about ADL's politics and activities. These materials should give pause to organizations or institutions, especially public ones, that partner with ADL in any enterprise. Here is a brief sampling of facts illustrated by these articles.
ADL does not represent even the Jewish community as a whole and is regarded with distaste by a large segment of it. That disaffection increased in 2015 when the directorship passed from Abe Foxman to hyper-partisan, radically left Jonathan Greenblatt. ADL has long engaged in smear attacks and hate-mongering against organizations and politicians who push for enforcement of immigration laws and the reduced quotas for legal immigration as long recommended by various national commissions. It continues to do so. ADL opposes the letter and spirit of the 1964 Civil Rights Act and the California Constitution; it endorsed the pro-racial preferences Proposition 16 in California in November 2020 while that was opposed by 57% of Californians. In a recent Supreme Court case, ADL submitted an amicus brief supporting Harvard’s discrimination against Asian applicants for admission. All of these positions and ADL's vicious use of smear tactics surely account for some of the antisemitism in the US. ADL has also recently teamed up with the pro-Proposition 16, anti-1964 Civil Rights Act administration of San Diego State University to deal with putative increases in antisemitism at SDSU.
Is Overimmigration in the U.S. Morally Defensible?, Ben Zuckerman & Stuart H. Hurlbert, San Diego Union Tribune, 3 August 2001.
Immigration Reform Must Address Racial Preferences, Ward Connerly & 26 Colleagues, Washington Times, 8 June 2007 (posted on The CAIRCO Report, 17 March 2021).
How Do We Build a Post Racial Society? (45min video in two parts), Ward Connerly, Writers Workshop, The Social Contract Press, 30 September 2012.
Misinformed accusations prevent reasoned discussion on immigration: The annotated version, Benjamin Zuckerman & Stuart H. Hurlbert, CAIRCO, August 2019.
How Sierrans for U.S. Population Stabilization (SUSPS) Advised Congress in 2001 - An historical perspective followed by the official testimony, Fred Elbel, Dick Schneider, William G. Elder, and Stuart H. Hurlbert, The Social Contract Winter 2019.
Memorializing A Dragon-Slaying and A Civil Rights Movement Reborn, Stuart H. Hurlbert, Minding the Campus, 10 January 2021.
Calming the waters in the San Dieguito Unified High School District, Stuart H. Hurlbert, Press Release, Californians for Equal Rights, 18 January 2022
San Dieguito school board fires superintendent, Kristin Taketa, San Diego Union-Tribune, 27 June 2022
The ADL Has Corrupted Its Mission and Betrayed the Jewish Community, by Avi Goldwasser and Charles Jacobs, Newsweek, 28 July 2022
Anti-Defamation League launches review of education content after Fox News Digital investigation, by Hannah Grossman, Fox News, 7 September 2022
The ADL's Critical Race Theory Curricula Is No Accident, by Jonathan Tobin, Newsweek, 9 September 2022.
Cultural Marxism, Political Correctness, and Critical Theory
Fighting Back Against Critical Race Theory
Progressive Marxist Education of Your Children
Barbara Jordan and the U.S. Commission on Immigration Reform
Barbara Jordan (1936-1996) was a Civil Rights leader and was the first African-American woman elected to the Texas Senate, in 1966. She was the elected to the U.S Congress and served from 1973 to 1979. She was the first African-American to deliver the keynote address at a Democratic National Convention, in 1976.
Barbara Jordan was appointed chair of the bi-partisan U.S. Commission on Immigration Reform in 1993 by President Bill Clinton. She served in that role until her death in January 1996. She definitively stated:
The Immigration Act of 1990 required that a bipartisan commission be created to examine the impacts of immigration on the United States and to make recommendations on immigration policy. Chair Barbara Jordan held a press conference in 1995 to release the Commission's recommendations on legal immigration. The Commission then issued its final report in 1997. The Jordan Commission specifically called for:
- an end to Chain Migration,
- the end of the Visa Lottery,
- an annual immigration flow of 550,000 new immigrants per year with a focus on highly-skilled workers, the nuclear family members of U.S. citizens and permanent residents,
- and United States' fair share of refugees and asylees (50,000 per year).
Watch Barbara Jordan's presentation at the 1995 press conference:
- Border management needs to be reinforced in order to prevent illegal immigration and facilitate legal entries. Increased resources are necessary for additional Border Patrol officers, inspectors, and operational support.
- Employment magnets for illegal aliens need to be eliminated through worksite enforcement. Economic gains and employment prospects are major pull factors of immigrants- including over-stayers. As Jordan (1995) noted, "roughly one-half of the nation's illegal alien problem results from visitors who entered legally but who do not leave when their time is up. Let me tell you in three simple words why that is: they get jobs…"
- Eligibility of illegal aliens for publicly-funded services or assistance (except those made available on an emergency basis) is ruled out: "Decisions about eligibility should support our immigration objectives. Accordingly, the Commission recommended against eligibility for illegal aliens "except in most unusual circumstances" (Jordan 1995).
- Coordinated strategies with foreign governments to address the causes of illegal immigration in sending countries. This can be done through development programs in an attempt to reduce the push factors of migration. Coordination with Mexico is fundamental, given its geographical proximity to the United States and its large flow of migrants.
- Increase the capacity in detention centers to facilitate the processing and removal of deportable aliens. A credible immigration policy requires the deportation of immigrants who have no right of residence. Going from the premise that "unlawful immigration is unacceptable," the Commission warned against rewarding illegal aliens. If aliens believe they can remain in the States indefinitely, they will be encouraged to enter or reside illegally.
- Amnesty is out of the question and "deportation is crucial."
- Reduce immigrant admission by 30 percent (from 822,000 to 550,000 admissions per year).
- Favor the admission of skilled immigrants instead of admitting immigrants based on extended family relations. The Commission found no justification for the continued entry of low-skilled foreign nationals.
- End chain migration by allowing immigrants to sponsor only spouses and minor children.
- Prevent the expansion of guest worker programs for low-skilled workers. The Commission found that low-skilled workers have far too few opportunities open to them: "When immigrants are less well-educated and less skilled, they may pose economic hardships for the most vulnerable of Americans."
- Eliminate the Visa Lottery (55,000 immigrant visas awarded randomly every year).
- Scrutinize the basic rules of naturalization. Naturalization should not be an avenue to welfare.
- Give more attention to the integration process and not just admission policies. The Commission found a great need to emphasize Americanization.
Barbara Jordan emphasized that Americanization (assimilation) was the most important component in the immigration process. She stated in 1995, "That word earned a bad reputation when it was stolen by racists and xenophobes in the 1920s. But it is our word, and we are taking it back."
Barbara Jordan made a number of important statements on immigration policy, some of which include:
Read more about Barbara Jordan:
Barbara Jordan’s Vision of Immigration Reform, NumbersUSA.
Barbara Jordan's Legal Immigration Recommendations, NumbersUSA.
The gulf between Barack Obama's immigration stance and Barbara Jordan's, NumbersUSA, November 30, 2012.
Recalling The Americanization Ideal - The Legacy of Barbara Jordan, FAIR.
Books - recommended reading
Here are some books on immigration, population, and sustainability that you might find interesting. This is not an exhaustive list, but it is a fairly comprehensive selection.
![]()
![]() Huddled Cliches is a short, 59-page, free online book by Lawrence Auster that effectively counters the mindless cliches used by the open borders lobby to further their agenda. The book was written in 1997 and revised in 2008. The immigration issue is still pressing upon the fate of America. Huddled Cliches is definitely worth a read by concerned Americans, especially since it is free! You can read Huddled Cliches in PDF format, or read Huddled Cliches in html format
Huddled Cliches is a short, 59-page, free online book by Lawrence Auster that effectively counters the mindless cliches used by the open borders lobby to further their agenda. The book was written in 1997 and revised in 2008. The immigration issue is still pressing upon the fate of America. Huddled Cliches is definitely worth a read by concerned Americans, especially since it is free! You can read Huddled Cliches in PDF format, or read Huddled Cliches in html format
![]()
![]() Illegal Entries by retired Border Patrol Special Agent John Slagle, ISBN 4-4140-4327-9. Available through AuthorHouse.com for $12.50 paperback; $4.50 electronic version.
Illegal Entries by retired Border Patrol Special Agent John Slagle, ISBN 4-4140-4327-9. Available through AuthorHouse.com for $12.50 paperback; $4.50 electronic version.
Illegal Entries is about the U.S. Border Patrol, illegal immigration, narcotics interdictions, terrorist factions and failed political policies spanning three decades. The book recounts first-hand field experience and provides an explanation of why 10 to 12 million illegal aliens are now in the US. Politicians from both parties in Congress, in a quest for cheap labor and votes, created the monster that is devouring the United States from within.
![]()
![]() Alien Nation: Common Sense About America's Immigration Disaster, Peter Brimelow; 1996, Harper Perennial Publishers (351p, $13).
Alien Nation: Common Sense About America's Immigration Disaster, Peter Brimelow; 1996, Harper Perennial Publishers (351p, $13).
Brimelow, an immigrant, maintains that besides the ill effects present immigration has on law enforcement, social service provision, public health, and the environment, it is undermining the sense of the U.S. as a nation. Throughout American history, immigration has occurred, not continuously, but in several waves that have alternated with long periods of assimilation--this is the pattern that built the nation and that the immigration tsunami touched off by the 1965 Immigration Act and complicated by the political resistance to assimilation known as multiculturalism has broken. The U.S. badly needs to drastically reduce immigration now, absorb the last 30 years' worth of new Americans, and rethink its immigration policies. (From Booklist, March 15, 1995).
![]() America Balkanized: Immigration's Challenge to Government, Brent A. Nelson; American Immigration Control Foundation, Box 525, Monterey, VA 24465, ISBN 0936247142 (148p, $10).
America Balkanized: Immigration's Challenge to Government, Brent A. Nelson; American Immigration Control Foundation, Box 525, Monterey, VA 24465, ISBN 0936247142 (148p, $10).
![]()
![]() Americans No More, The Death Of Citizenship Georgie Anne Geyer; Atlantic Monthly Press, 1996, ISBN 0-87113-650-3, (352p, $23).
Americans No More, The Death Of Citizenship Georgie Anne Geyer; Atlantic Monthly Press, 1996, ISBN 0-87113-650-3, (352p, $23).
A controversial but much-needed book asking the questions posed by our founding fathers: "What makes an American citizen? Who belongs to the American polity, and why?"
![]() Blurred Boundaries: Migration, Ethnicity, Citizenship, Rainer Baubock (Ed.), John Rundell (Ed.); Ashgate Publishing, 1999, ISBN 1840148934, ($42).
Blurred Boundaries: Migration, Ethnicity, Citizenship, Rainer Baubock (Ed.), John Rundell (Ed.); Ashgate Publishing, 1999, ISBN 1840148934, ($42).
From the publisher: The underlying theme of the book are new forms of cultural diversity which result from migration and globalization. The book addresses two tasks: 1) To compare different national contexts and types of ethnic groups (immigrant and indigenous, linguistic and religious minorities) and to discuss how policies of multicultural integration have to be adapted in order to cope with such differences. 2) To evaluate the impact of common trends of globalization which link societies and encourage convergence between national models of multicultural integration.
![]() BIAS: A CBS Insider Exposes How the Media Distort the News, Bernard Goldberg; Regnery Publishing, 2002 (232 p).
BIAS: A CBS Insider Exposes How the Media Distort the News, Bernard Goldberg; Regnery Publishing, 2002 (232 p).
Goldberg, an old-fashioned liberal, clearly shows how the media repeatedly ignores their primary mission of objective, disinterested reporting. He blows the whistle on the media and shows how they slant coverage while insisting that they're just reporting the facts.
![]()
![]() Coloring the News: How Crusading for Diversity Has Corrupted American Journalism, William McGowan; Encounter Books, 2002, ISBN 1-893554-28-7 (278 p).
Coloring the News: How Crusading for Diversity Has Corrupted American Journalism, William McGowan; Encounter Books, 2002, ISBN 1-893554-28-7 (278 p).
McGowan thoroughly examines the premise of newspaper reporters and editors that promoting 'diversity' in the newsroom has produced better reporting and journalism. Instead, quota hiring and 'diversity' reporting practices have discouraged good journalism in favor of biased, one-sided journalism. The overview section alone provides excellent insight into the pervasive problems resulting from the misguided emphasis on 'diversity' reporting today.
![]() Common Sense on Mass Immigration, The Social Contract Press, 2004 ($1).
Common Sense on Mass Immigration, The Social Contract Press, 2004 ($1).
This small booklet contains 20 articles on mass immigration. This booklet is an excellent introduction to the topic and is ideal to distribute to those who are not fully informed on the issue.
![]()
![]() Elephants in the Volkswagen Lindsay Grant; ed. W.H. Freeman & Co., 1992, ISBN 0-7167-2267-4, $22.95. 0-7167-2268-2 (pbk.), (272p, $13.95). Available from The Social Contract Press, Petoskey, MI 49770, 800.352.4843, ISBN 0-7167-2268-2, (272p, $15).
Elephants in the Volkswagen Lindsay Grant; ed. W.H. Freeman & Co., 1992, ISBN 0-7167-2267-4, $22.95. 0-7167-2268-2 (pbk.), (272p, $13.95). Available from The Social Contract Press, Petoskey, MI 49770, 800.352.4843, ISBN 0-7167-2268-2, (272p, $15).
A series of essays courageously attacking the hard questions about overpopulation. The reader may be surprised to learn that we really can do something about overpopulation.
![]() Fences and Neighbors: The Political Geography of Immigration Control, Jeannette Money; Cornell Univ Press, 1999, ISBN 0801435706, (264p, $40).
Fences and Neighbors: The Political Geography of Immigration Control, Jeannette Money; Cornell Univ Press, 1999, ISBN 0801435706, (264p, $40).
The author draws on detailed evidence from Britain, France, Australia, and the United States, to demonstrate that local support for immigration is contingent upon economic conditions, as also dependent on the number of foreigners entering the country and their access to the welfare state. Only if local constituencies are critical to maintaining a national electoral majority will local pressures be translated into national immigration policies.
![]() Fifty Million Californians, Leon Bouvier; 1991, ISBN: 1881290247, (93p, $10).
Fifty Million Californians, Leon Bouvier; 1991, ISBN: 1881290247, (93p, $10).
In this state-specific study, Dr. Bouvier outlines the impact of heavy immigration on various states and the disastrous future to which it leads.
![]()
![]() Fighting Immigration Anarchy - American Patriots Battle to Save the Nation, Daniel Sheehy; Authorhouse, 2005, ISBN 1-4208-6631-1 (hardcover, $24), ISBN 1-4208-6632-X (softcover, $16), (329 p).
Fighting Immigration Anarchy - American Patriots Battle to Save the Nation, Daniel Sheehy; Authorhouse, 2005, ISBN 1-4208-6631-1 (hardcover, $24), ISBN 1-4208-6632-X (softcover, $16), (329 p).
This book is a frightening alarm of the ethnic disorder and financial breakdown that are created by the corrupt political, business, and media elites pursuing a globalist agenda. But the book also provides hope that America can be preserved as a unique nation under the rule of law. The tales of individual citizens seizing the initiative to do the job Washington won’t — protect the country from foreign invasion — are both an inspiration and a playbook. In the spirit of 1776, dedicated patriots show how it’s done, and prove that individual courage still matters.
![]()
![]() Fixing the INSanity, Neville W. Cramer, Special Agent, INS (Retired), Immigration Enforcement Solutions, LLC, 2005, ISBN: 0976282003, (197p, $20)
Fixing the INSanity, Neville W. Cramer, Special Agent, INS (Retired), Immigration Enforcement Solutions, LLC, 2005, ISBN: 0976282003, (197p, $20)
![]() Florida in the 21st Century, Leon Bouvier; ($11).
Florida in the 21st Century, Leon Bouvier; ($11).
In this state-specific study, Dr. Bouvier outlines the impact of heavy immigration on various states and the disastrous future to which it leads.
![]() Global Futures: Migration, Environment, and Globalization, Avtar Brah (Ed.), Mary J. Hickman (Ed.), Mairtin Mac an Ghaill (Ed.), St Martins Press, 1999, ISBN 0312221355, (288p, $69).
Global Futures: Migration, Environment, and Globalization, Avtar Brah (Ed.), Mary J. Hickman (Ed.), Mairtin Mac an Ghaill (Ed.), St Martins Press, 1999, ISBN 0312221355, (288p, $69).
![]()
![]() Heaven's Door: Immigration Policy and the American Economy, George J. Borjas; Princeton Univ Press, 1999, ISBN 0691059667, (264p, $28), (review).
Heaven's Door: Immigration Policy and the American Economy, George J. Borjas; Princeton Univ Press, 1999, ISBN 0691059667, (264p, $28), (review).
The U.S. took in more than a million immigrants per year in the late 1990s, more than at any other time in history. For humanitarian and many other reasons, this may be good news. But as George Borjas shows in Heaven's Door, it's decidedly mixed news for the American economy--and positively bad news for the country's poorest citizens.
![]() How Many Americans: Population, Immigration, and the Environment, Leon F. Bouvier & Lindsey Grant.
How Many Americans: Population, Immigration, and the Environment, Leon F. Bouvier & Lindsey Grant.
The population of the United States has tripled within this century, and our over-consumption of resources is a leading cause of many international environmental problems including acid rain and global warming. Lowering mass immigration levels becomes necessary in order to achieve environmental sustainability.
![]() How to Win the Immigration Debate, Scipio Garling; Federation for American Immigration Reform, 1997, ISBN 0935776249, (150p, $5).
How to Win the Immigration Debate, Scipio Garling; Federation for American Immigration Reform, 1997, ISBN 0935776249, (150p, $5).
![]() Importing Revolution: Open Borders and the Radical Agenda, William R. Hawkins; American Immigration Control Foundation, Box 525, Monterey, VA 24465, 1994, ISBN 0936247150, (209p, $8).
Importing Revolution: Open Borders and the Radical Agenda, William R. Hawkins; American Immigration Control Foundation, Box 525, Monterey, VA 24465, 1994, ISBN 0936247150, (209p, $8).
![]()
![]() Invasion: How America Still Welcomes Terrorists, Criminals, and Other Foreign Menaces to Our Shores, Michelle Malkin; Regnery Publishing, 2002, ISBN 0-89526-146-4, (332 p).
Invasion: How America Still Welcomes Terrorists, Criminals, and Other Foreign Menaces to Our Shores, Michelle Malkin; Regnery Publishing, 2002, ISBN 0-89526-146-4, (332 p).
An important book and a stunning indictment of how our government lets known terrorists, murders, and criminals into the U.S. Malkin shows how political correctness, liberal bias, and outright fraud have endangered and cost American lives.
Read the transcript of Brian Lamb's interview of Michelle Malkin on C-Span's booknotes.
![]() Mexican Migration to the United States: The Role of Migration Networks and Human Capital Accumulation, Steven Zahniser; Garland Publishing, 1999, ISBN 0815331991, (250p, $79).
Mexican Migration to the United States: The Role of Migration Networks and Human Capital Accumulation, Steven Zahniser; Garland Publishing, 1999, ISBN 0815331991, (250p, $79).
From the Garland Studies in the History of American Labor.
![]() Mexifornia: A State of Becoming, Victor Davis Hanson, Encounter Books, 2003, ISBN 1893554732.
Mexifornia: A State of Becoming, Victor Davis Hanson, Encounter Books, 2003, ISBN 1893554732.
A valuable and truly insightful analysis; readers genuinely interested in the subject would do well to take in what he has to report.
![]() Misplaced Blame: The Real Roots of Population Growth, Alan Thein Durning and Christopher D. Crowther; Northwest Environment Watch; ISBN 1886093059, (1997).
Misplaced Blame: The Real Roots of Population Growth, Alan Thein Durning and Christopher D. Crowther; Northwest Environment Watch; ISBN 1886093059, (1997).
The authors argue that much of the population growth overrunning parts of North America springs from rarely-noted root causes: poverty, sexual abuse, underfunded family planning services, subsidies to domestic migration, and ill-guided immigration policy. From Center for Immigration Studies: Each chapter identifies one "root" of population growth, including Root 5, Misguided Immigration Laws. While strongly defending immigrants' rights, the report notes that supporting recent immigrants is not the same as supporting open-throttle immigration, and concludes that proper immigration reform would end up closing the immigration door quite a bit --perhaps reducing immigration rates by half, perhaps by more.
![]()
![]() Overshoot, The Ecological Basis of Revolutionary Change, William R. Catton, Jr.; University of Illinois Press, 1980, ISBN 0-252-00818-9 (hard cover), (270p, $30), ISBN 0-252-00988-6 (paperback).
Overshoot, The Ecological Basis of Revolutionary Change, William R. Catton, Jr.; University of Illinois Press, 1980, ISBN 0-252-00818-9 (hard cover), (270p, $30), ISBN 0-252-00988-6 (paperback).
An important book - well written with a rich bibliography.
![]() Population Growth -- The Neglected Dimension of America's Persistent Energy/Environmental Problems by Leon Kolankiewicz , NumbersUSA Education and Research Foundation
Population Growth -- The Neglected Dimension of America's Persistent Energy/Environmental Problems by Leon Kolankiewicz , NumbersUSA Education and Research Foundation
![]() Population Growth Control: The Next Move is America's, Stephen D. Mumford; 1977, ISBN 0802222005, (out of print).
Population Growth Control: The Next Move is America's, Stephen D. Mumford; 1977, ISBN 0802222005, (out of print).
![]()
![]() Re-charting America's Future: Responses to Arguments Against Stabilizing U.S. Population, Roy Beck; The Social Contract Press, Petoskey, MI 49770, 1994, 800.352.4843, ISBN 1881780066, (217p, $10).
Re-charting America's Future: Responses to Arguments Against Stabilizing U.S. Population, Roy Beck; The Social Contract Press, Petoskey, MI 49770, 1994, 800.352.4843, ISBN 1881780066, (217p, $10).
Examines the arguments used to justify federal immigration policies that force U.S. population growth, both of which are opposed by the majority of Americans.
![]() Immigration Statistics: Information Gaps, Quality Issues Limit Utility of Federal Data to Policymakers, Eric M. Larson; Diane Publishing, ISBN: 0788177338, (87 p, $20), (order directly from publisher).
Immigration Statistics: Information Gaps, Quality Issues Limit Utility of Federal Data to Policymakers, Eric M. Larson; Diane Publishing, ISBN: 0788177338, (87 p, $20), (order directly from publisher).
![]()
![]() Stalking the Wild Taboo, Garret Hardin; Social Contract Press; ISBN 1881780112, (376p, $16).
Stalking the Wild Taboo, Garret Hardin; Social Contract Press; ISBN 1881780112, (376p, $16).
This first volume in the Garrett Hardin Reprint Series has over sixty pages of new material including a new preface and three never-before-published essays. Dr. Hardin undertakes to shatter the misconceptions that haunt and confuse many of the most important topics of our times.
![]() State Profiles: The Population & Economy of Each U.S. State (State Profiles, 1999), Courtenay M. Slater (Ed.), Martha Davis; Bernan Associates, 1999, ISBN 0890591598, (450p, $65).
State Profiles: The Population & Economy of Each U.S. State (State Profiles, 1999), Courtenay M. Slater (Ed.), Martha Davis; Bernan Associates, 1999, ISBN 0890591598, (450p, $65).
Locate economic and demographic data for each U.S. state presented in compact, standardized state chapters using charts, tables and interpretive text. Population, income, employment, earnings by industry, education, exports and government finances are among the topics covered. The standardized format facilitates easy comparisons of data among the states. Comparable national and regional data also are included.
![]()
![]() The Case Against Immigration, Roy Beck; W.W. Norton & Co., 1996, ISBN 0-393-03915-3, (287p, $24). This book is not anti-immigrant, but makes a convincing case that the impact of mass immigration is devastating and the need for new legislation urgent.
The Case Against Immigration, Roy Beck; W.W. Norton & Co., 1996, ISBN 0-393-03915-3, (287p, $24). This book is not anti-immigrant, but makes a convincing case that the impact of mass immigration is devastating and the need for new legislation urgent.
![]() The Death of the West, Patrick J. Buchanan; St. Martin's Press, 2002, ISBN 0-312-28548-5 (308p, $26).
The Death of the West, Patrick J. Buchanan; St. Martin's Press, 2002, ISBN 0-312-28548-5 (308p, $26).
The Environmentalist's Guide to a Sensible Immigration Policy Scipio Garling, Ira Mehlman; Federation for American Immigration Reform, 1999, ISBN 0-935776-26-5, (63 p, $10).
A well-written and easily-read booklet presenting the environmental impacts of the population and mass immigration problem.
![]() The Immigration Debate, Ed. James P. Smith; National Academy Press, 1998, ISBN 0309059984, (300p, $47). [This book is available online - see The Impact of Recent Immigration on Population Redistributrion Within the United States.
The Immigration Debate, Ed. James P. Smith; National Academy Press, 1998, ISBN 0309059984, (300p, $47). [This book is available online - see The Impact of Recent Immigration on Population Redistributrion Within the United States.
Includes case studies of the fiscal effects of immigration in New Jersey and California, studies of the impact of immigration on population redistribution and on crime in the United States, and much more.
![]()
![]() The Immigration Dilemma: Avoiding the Tragedy of the Commons, Garrett Hardin; Federation For Immigration Reform, ISBN 0-935776-15-X, 1995, (140p, $5).
The Immigration Dilemma: Avoiding the Tragedy of the Commons, Garrett Hardin; Federation For Immigration Reform, ISBN 0-935776-15-X, 1995, (140p, $5).
This collection of Hardin's writings shows how timely his warnings have been that too many people pursuing scarce resources spell ultimate disaster. A sorely-needed moral compass on the issues of immigration.
![]() Mechanics of Immigration Control: A Comparative Analysis of European Regulation Policies, Tomas Hammar, Grete Brochmann; New York University Press, 1999, ISBN 1859732674, (316p, $65).
Mechanics of Immigration Control: A Comparative Analysis of European Regulation Policies, Tomas Hammar, Grete Brochmann; New York University Press, 1999, ISBN 1859732674, (316p, $65).
![]() The Immigration Invasion, Wayne Lutton & John Tanton; 1994, The Social Contract Press, Petoskey, MI 49770, 800.352.4843, (190p, $5).
The Immigration Invasion, Wayne Lutton & John Tanton; 1994, The Social Contract Press, Petoskey, MI 49770, 800.352.4843, (190p, $5).
The authors present an ethical framework for setting immigration policy, followed by detailed and specific recommendations for changes.
![]() The Life and Death of NSSM 200 ("National Security Study Memorandum 200") - How the Destruction of Political Will Doomed a U.S. Population Policy, Stephen D. Mumford, Center for Research on Population and Security, P.O. Box 13067, Research Triangle Park, North Carolina 27709, 919.933.7491, ISBN 093730705X. Read the overview. Read Part 1 - Analytical Section. Read the entire book
The Life and Death of NSSM 200 ("National Security Study Memorandum 200") - How the Destruction of Political Will Doomed a U.S. Population Policy, Stephen D. Mumford, Center for Research on Population and Security, P.O. Box 13067, Research Triangle Park, North Carolina 27709, 919.933.7491, ISBN 093730705X. Read the overview. Read Part 1 - Analytical Section. Read the entire book
![]() The Path To National Suicide, Lawrence Auster; American Immigration Control Foundation, PO Box 525, Monterey, VA 24465, 1990, ISBN 0-936247-12-6, (94p).
The Path To National Suicide, Lawrence Auster; American Immigration Control Foundation, PO Box 525, Monterey, VA 24465, 1990, ISBN 0-936247-12-6, (94p).
![]() Thirty Million Texans, Leon Bouvier; ISBN 1881290204, (93p, $11). In this state-specific study, Dr. Bouvier outlines the impact of heavy immigration on various states and the disastrous future to which it leads.
Thirty Million Texans, Leon Bouvier; ISBN 1881290204, (93p, $11). In this state-specific study, Dr. Bouvier outlines the impact of heavy immigration on various states and the disastrous future to which it leads.
![]() Unguarded Gates - A History of America's Immigration Crisis by Otis L. Graham, Jr. (Rowman & Littlefield, 2004, ISBN 0-7425-2228-8). (Read reviews on Amazon.com).
Unguarded Gates - A History of America's Immigration Crisis by Otis L. Graham, Jr. (Rowman & Littlefield, 2004, ISBN 0-7425-2228-8). (Read reviews on Amazon.com).
![]() Unwelcome Strangers: American Identity and the Turn Against Immigration, David M. Reimers; Columbia Univ Press, 1999, ISBN 0231109571, ($18).
Unwelcome Strangers: American Identity and the Turn Against Immigration, David M. Reimers; Columbia Univ Press, 1999, ISBN 0231109571, ($18).
A definitive history of the current immigration reduction movement. This book discusses both sides of the economic, social, and environmental arguments against mass immigration. Excellent reading for both historians and current policy makers.
![]() Whatever It Takes, J. D. Hayworth, Regnery Publishing, Inc., 2006, ISBN 089526028X, (256 p, $18). An excellent and informative read exposing the illegal immigration and border security crisis. (Review).
Whatever It Takes, J. D. Hayworth, Regnery Publishing, Inc., 2006, ISBN 089526028X, (256 p, $18). An excellent and informative read exposing the illegal immigration and border security crisis. (Review).
![]() World Population, Leon F. Bouvier, Jane T. Bertrand; Seven Locks Press, 1999, ISBN: 0929765664, (203 p, $13).
World Population, Leon F. Bouvier, Jane T. Bertrand; Seven Locks Press, 1999, ISBN: 0929765664, (203 p, $13).
"Readable, insightful, scholarly, and objective. Whatever your view on population growth, few disagree that it presents the future with some major challenges. An important book about a fast developing, worldwide problem." -- Richard D. Lamm.
"Bouvier and Bertrand's new book offers a measured and informed appraisal - for those who would prefer to actually understand." -- Michael S. Teitelbaum.
![]() World War III, Population and the Biosphere At the End of the Millennium, Michael Tobias; Continuum Pub Group, 1997, ISBN 0826410855, (300p, $16); (review essay). Also available from DESIP bookstore.
World War III, Population and the Biosphere At the End of the Millennium, Michael Tobias; Continuum Pub Group, 1997, ISBN 0826410855, (300p, $16); (review essay). Also available from DESIP bookstore.
Tobias argues that humanity is waging a war of aggression against the planet. He travels around China, Indonesia, India, Kenya, the US, and Antarctica and returns, laden with fact and anecdote, to tell us that there are too many of us and that rapine economic development is killing the planet. At current birth and death rates, the world is adding a Los Angeles every three weeks. Tobias is both knowledgeable and passionate in his presentation.
Cloward-Piven strategy - fundamentally transforming America
What is the Cloward-Piven strategy?
The Cloward-Piven strategy was developed in 1966 by Americans Richard Cloward and Frances Fox Piven - both sociologists and political activists. The Cloward-Piven strategy focused on overloading the United States public welfare system in order to precipitate a crisis, which would ultimately lead to replacing the welfare system with a national system of "a guaranteed annual income and thus an end to poverty".
An ancillary consequence of the strategy includes shoring up of the Democrat Party, which at the time was splintered by pluralistic interests. Another side effect would be relieving local and state governments of public welfare burdens, since the burden would be shifted to the federal government - in other words, in a manifestation of socialism. Taxpayers, of course, would cover the cost in either case.
Cloward and Piven focused primarily on redistribution of income, stating that full enrollment in welfare programs:
"would produce bureaucratic disruption in welfare agencies and fiscal disruption in local and state governments" that would: "...deepen existing divisions among elements in the big-city Democratic coalition: the remaining white middle class, the working-class ethnic groups and the growing minority poor. To avoid a further weakening of that historic coalition, a national Democratic administration would be constrained to advance a federal solution to poverty that would override local welfare failures, local class and racial conflicts and local revenue dilemmas."...
The ultimate objective of this strategy - to wipe out poverty by establishing a guaranteed annual income - will be questioned by some. Because the ideal of individual social and economic mobility has deep roots, even activists seem reluctant to call for national programs to eliminate poverty by the outright redistribution of income.
Near-term effects of the Cloward-Piven strategy
In a new 2010 introduction to the original article, Frances Fox Piven wrote in The Nation:
Political commentator James McWhorter wrote in his 2006 book Winning the Race that the rise in the welfare state after the 1960s could be attributed to the Cloward Piven strategy. He reported that the strategy unfortunately "created generations of black people for whom working for a living is an abstraction."
Whether or not the above point is wholly true, the strategy has effected change, as noted by Piven.
Long-term effects of the Cloward-Piven strategy
The strategy, while originally intended to bring about a socialistic guaranteed national income, remains a viable way to transform an entire nation. Indeed, many of the changes we see in America today are consistent within the framework of the Cloward-Piven strategy. A few examples are provided below:
1965 Immigration Act
The 1965 Immigration Act marked the turning point when American immigration was no longer managed for the American interest. In his article The Collapse of America - A Plan Decades in the Making, David Risselada states:
In my article "Amnesty and the Immigration Act of 1965", I discussed the origins of the immigration crisis we are now facing and how it was nothing but a plot to secure more voters for the Democrat Party. This was based on the ideas of Marxism and the teachings of Antonio Gramsci, who taught that America's culture would have to be changed incrementally from within. The immigration act of 1965 was signed into law by Democrat President Lyndon B. Johnson. This is the same president who promised Americas black communities free welfare for their votes...
At the time America's immigration laws were based on a quota system, meaning that immigrants from any part of the world were allowed in based on the number of existing immigrants already in country from that part of the world. This was done in an effort to maintain national identity and ensure that people with useful skills and a desire to assimilate into our culture would be the ones to immigrate here. This meant that most of the people who were immigrating here were of European ancestry and just as is the case today, people referred to this as a racist system...
It should be noted that this act resulted in ever-increasing numbers of foreigners - both legal and illegal - entering America who would become dependent on America's generous taxpayer-paid welfare system.
2008 financial crisis
There is plenty blame to go around for the financial crash. Yet, there is a distinct odor of the shadowy Cloward-Piven strategy as the taproot of abusive practices that triggered the crisis. The strategy’s goal is to bring about the fall of capitalism by overloading and undermining government bureaucracy.
Its supporting tactics include flooding government with impossible demands until it slowly cranks to a stop; overloading electoral systems with successive tidal waves of new voters, many of them bogus; shaking down banks, politicians in Congress, and the Department of Housing and Urban Development for affirmative-action borrowing; and, now, pulling down the national financial system by demanding exotic, subprime mortgages for low-income Americans with little hope of repaying their loans. These toxic mortgages are an important source of the foul smell engulfing the entire financial bailout...
Stanley Kurtz of the Ethics and Public Policy Center explained that "community organizers help to undermine America’s economy by pushing the banking system into a sink-hole of bad loans."...
2014 Border crisis - Unaccompanied Alien Children
In Summer 2014, a massive influx of unaccompanied alien children (UACs) inundated our southern border. Barak Obama's immigration actions (or lack thereof) seemed to be an efficacious implementation of the Cloward-Piven strategy. Elizabeth Lee Vliet, M.D. warned that "Carried by this tsunami of illegals are the invisible “travelers” our politicians don’t like to mention: diseases the U.S. had controlled or virtually eradicated: tuberculosis (TB), Chagas disease, dengue fever, hepatitis, malaria, measles, plus more."
Obama invited these minors into the US. He has virtually gutted America's immigration enforcement system, and has taken even more outrageous executive actions. Of course, both political parties are culpable, as there is an active bipartisan amnesty exponent in Congress.
The 2014 border crisis was a manufactured crisis of the first order, which in the short term backfired. Virginia voters immediately fired House Majority Leader Eric Cantor (R-VA), predominantly because he signed on to the Republican amnesty plan and expressed intent to work with Obama on a "Kids Act" for Dreamers. But the long-term damage remains.
2015 Syrian refugees - importing terrorism
After the November 2015 Paris Islamic terrorist attacks, Obama recommitted to bring Syrian "refugees" into the United States. This was notwithstanding the facts that a sizeable proportion are not from Syria, a majority are young men of military age, and that the U.S. government has no way to vet those coming in as "refugees".
Such refugees would become an additional burden on American taxpayers and could indeed comprise a very real terrorist threat.
Read more - see Syrian refugees and national security the Refugee Resettlement racket.
The end result - fundamentally transforming America
In the 2014 article, Why the White House Wants Amnesty, Ben Shapiro writes:
Cloward-Piven’s goal was to create impetus for government to guarantee a universal living. The modern Democrat Party is significantly less interested in guaranteed benefits than for an economic leveling. The motivating factor of the left is not caring for the poor but tearing down the wealthy...
And so the Democrats will move to bankrupt the system. No welfare state can survive with open borders. That is a truism. And yet that’s exactly what Democrats are now promoting: open borders with a full welfare state. Why? Not because Democrats believe that the homegrown poor in America will be better off with more people joining them on the dole; they won’t. Rather, Democrats love the size and scope of the state and despise the rival the state faces in individual success. A growing welfare base requires higher taxation, more degradation of individual success. That is the goal...
The Cloward-Piven strategy remains an active instrument of change in America. Ultimately, it is the tool by which multicultural elites aim to "fundamentally transform America."
References
The Collapse of America - A Plan Decades in the Making, David Risselada, Freedom Outpost, July 16, 2014. (This article contains a many additional references.)
The Cloward–Piven strategy, Richard Chandler, The Washington Times, October 15, 2008.
The Weight of the Poor: A Strategy to End Poverty, Richard Cloward and Frances Piven, The Nation, March 8, 2010 (original 1966 article with updated introduction).
The Weight of the Poor: A Strategy to End Poverty, Richard Cloward and Frances Piven, Common Dreams, March 24, 2010 (original 1966 article from The Nation).
Bad News for Liberals May Be Good News for a Liberal Magazine, Jeremy W. Peters, The New York Times, November 7, 2010.
John McWhorter: How Welfare Went Wrong NPR, John McWhorter, August 9, 2006.
Chandler: The Cloward-Piven strategy, Robert Chandler, The Washington Times, October 15, 2008.
Cloward-Piven at the border, John Hayward, Human Events, June 10, 2014.
Unaccompanied Alien Children (UAC) - Illegal alien kiddie colonists invited by Obama administration, CAIRCO, August 21, 2014.
Deadly diseases crossing border with illegals, Elizabeth Lee Vliet, M.D., World Net Daily, June 20, 2014.
Colorado won't block Syrian refugees, November 17, 2015.
Syrian refugees and national security.
The Refugee Resettlement racket.
“It is intentional therefore it is evil”
The Cloward Pliven Strategy pic.twitter.com/MUPBVlUAXK
— Concerned Citizen (@BGatesIsaPyscho) September 8, 2024
Colorado legislative process
Here is basic information on the Colorado legislative process. The legislative session begins in January and lasts 120 days. During the session, bills will be introduced. In general, deadline requirements require bills to be introduced by the end of January.
After a bill is introduced, it will be heard before committee. At least one of the committee hearings will allow public testimony, where elected public servants' bosses (citizens of Colorado - that's you) can give a three-minute testimony in favor of or in opposition to a bill.
You can also contact cosponsors of bills and find opponents of a bill to express your position on the bill.
More information:
See this diagram on how a bill becomes Colorado law.
Find bills in the Colorado Legislature.
Here is the deadline schedule for the 2014 Colorado General Assembly.
Here are Colorado legislative committees. See information on committee meetings both during legislative session and during the interim.
Here is how to contact Colorado state legislators in your district / city / county.
Congressional voting records and grade cards
In order to track U.S. Congressional voting on immigration issues, FAIR issues periodic Voting Reports. Here are voting reports from the 114th Congress, First Session (January, 2016): House and Senate.
NumbersUSA also produces comprehensive Congressional Immigration-Reduction Grades. Here are the Congressional immigration grades for Colorado.
Here is how to contact your US Senators and Representatives from Colorado. Here is how to contact Colorado state legislators in your district / city / county.
Delphi Technique - how to manipulate public meetings
Public meetings concerning refugee resettlement can be covertly manipulated in order to achieve precise results desired by the facilitator. This method is being used in several settings to short-circuit legitimate concerns of local residents regarding forced resettlement of Syrian refugees in their communities.

As pointed out in the article Beware the Delphi Technique! This time in Billings, Montana, a Billings Montana Presbyterian Church plans to hold a community meeting about Syrian refugees. The Delphi Technique will be used to implicitly manipulate the outcome of the meeting:
"Participants will join in small groups, with some members in favor of settling Syrian refugees in Montana and others who are concerned about the safety and security of citizens if Syrian refugees are permitted. A facilitator will encourage each person to tell his or her story and background, after which participants will explore any areas of common agreement. [Keep in mind that this ‘story and background’ mumbo jumbo is just one more strategy used to play on your emotions and stop logical debate.—ed]"
The Delphi Technique was developed in the 1950s by the RAND Corporation for the U.S. Department of Defense. It was originally intended as a psychological weapon for use during the cold war. However, the technique is effective in manipulating any meeting toward a predetermined end. The steps of the technique include:
- The facilitator (the change agent) must be someone with whom most of the audience can identify.
- The facilitator initially identifies potential opponents and frames them as foolish, aggressive, etc., thus warming the rest of the audience to the facilitator.
- The audience is broken into six or eight discussion groups, with topics chosen by the facilitator. Typically, members are asked to write down concerns and turn them in to the facilitator.
- The facilitator selects only concerns from the compilation that are consistent with the desired outcome. These concerns are then addressed in the final discussion, which ultimately supports the desired results.
- The participants and the community at large are told that the conclusions reached at the meeting were the result of open public participation.
Here is more information about the Delphi Technique:
- Never, never lose your temper!
- Stay focused! Write down your questions and statements in advance.
- Facilitators are trained to twist things to make anyone not acceding to their agenda look foolish or aggressive. Wait until the facilitator finishes speaking and then bring them back to your question. Be persistent!
- Go with like-minded people, but don't sit together as a group. When the facilitator avoids addressing your question and moves to someone else in the audience, another compatriot can ask a related question.
- Turn the technique back on the facilitator and isolate them as the kook.
- As noted in the article below, do not congregate during recesses. Spotters will infiltrate dissident groups and report back to the facilitator, who will then avoid calling on those individuals.
Using the Delphi Technique to Achieve Consensus - How it is leading us away from representative government to an illusion of citizen participation, Education Reporter, Eagle Forum, 1998:
The Delphi Technique and consensus building are both founded in the same principle - the Hegelian dialectic of thesis, antithesis, and synthesis, with synthesis becoming the new thesis. The goal is a continual evolution to "oneness of mind" (consensus means solidarity of belief) - the collective mind, the wholistic society, the wholistic earth, etc. In thesis and antithesis, opinions or views are presented on a subject to establish views and opposing views. In synthesis, opposites are brought together to form the new thesis. All participants in the process are then to accept ownership of the new thesis and support it, changing their views to align with the new thesis. Through a continual process of evolution, "oneness of mind" will supposedly occur.
In group settings, the Delphi Technique is an unethical method of achieving consensus on controversial topics. It requires well-trained professionals, known as "facilitators" or "change agents," who deliberately escalate tension among group members, pitting one faction against another to make a preordained viewpoint appear "sensible," while making opposing views appear ridiculous...
The Delphi Technique works. It is very effective with parents, teachers, school children, and community groups. The "targets" rarely, if ever, realize that they are being manipulated. If they do suspect what is happening, they do not know how to end the process. The facilitator seeks to polarize the group in order to become an accepted member of the group and of the process. The desired idea is then placed on the table and individual opinions are sought during discussion. Soon, associates from the divided group begin to adopt the idea as if it were their own, and they pressure the entire group to accept their proposition...
While the Delphi Technique can be used to achieve a hidden agenda that is in opposition to public interest, it is most certainly an unethical technique when used in the context of public meetings. The means of defeating the technique are awareness of its use, and a few simple steps as noted above.
E-Verify program
The Immigration Reform and Control Act (IRCA) of 1986 prohibits employers from knowingly hiring illegal workers. To comply with this law, employers must collect information regarding an employee's identity and employment eligibility and document that information on Form I-9. An employee must provide certain information on the form, such as name and date of birth, as well as present supporting documents.
E-Verify is an Internet-based system that allows businesses to determine the eligibility of their employees to work in the United States. E-Verify offers employers a powerful tool in protecting themselves against those who try to cheat the system. The E-verify program verifies the status of newly hired employees, while the IMAGE certification program examines older hiring records in order to detect phony documents used by illegal alien workers.
E-Verify is fast, free and easy to use, and it's the best way employers can ensure a legal workforce. E-Verify compares information from an employee's Form I-9, Employment Eligibility Verification, to data from U.S. Department of Homeland Security and Social Security Administration records to confirm employment eligibility.
U.S. law requires companies to employ only individuals who may legally work in the United States - either U.S. citizens, or foreign citizens who have the necessary authorization.
More than 409,000 employers, large and small, across the United States use E-Verify to check the employment eligibility of their employees, with about 1,300 new businesses signing up each week.
While participation in E-Verify is voluntary for most businesses, some companies may be required by state law or federal regulation to use E-Verify. For example, most employers in Arizona and Mississippi are required to use E-Verify. E-Verify is also mandatory for employers with federal contracts or subcontracts that contain the Federal Acquisition Regulation E-Verify clause.
E-Verify's most impressive features are its speed and accuracy. E-Verify is the only service that verifies employees' data against millions of government records and provides results within seconds. There's no other program that provides the same peace of mind in such little time.
E-Verify compares the information an employee provides on Form I-9, Employment Eligibility Verification, against millions of government records and generally provides results in three to five seconds. If the information matches, that employee is eligible to work in the United States. If there's a mismatch, E-Verify will alert the employer and the employee will be allowed to work while he or she resolves the problem.
How E-Verify works
E-Verify is closely linked to Form I-9, Employment Eligibility Verification, and exists to strengthen the Form I-9 employment eligibility verification process that all employers, by law, must follow. While participation in E-Verify is voluntary for most employers, completion of Form I-9 is required of all employers.
E-Verify works by comparing information entered from an employee's Form I-9 to 455 million Social Security Administration (SSA) records and 80 million U.S. Department of Homeland Security records.
U.S. Department of Homeland Security databases contain records about employment-based visas, immigration and naturalization status, and U.S. passport issuance, which allow E-Verify to compare information against a wide variety of sources.
By adding E-Verify to the existing Form I-9 employment eligibility verification process, a company can benefit from the peace of mind of knowing that it maintains a legal workforce.
Before a company can use E-Verify to verify the employment eligibility of its employees, the company and employee must first complete Form I-9. All of the Form I-9 rules that companies followed before signing up for E-Verify still apply with two exceptions.
- Employees must provide their Social Security numbers on Form I-9. (Providing a Social Security number on Form I-9 is voluntary unless the employer participates in E-Verify.)
- Any List B document that employees present must contain a photo. (Some List B documents without photos are acceptable unless the employer participates in E-Verify.)
Once Form I-9 is completed, the company enters the information from Form I-9 into E Verify. Depending on the documents an employee provides, the employer may have to compare a photo displayed on a computer screen to the photo on the employee's document. The photos should match, which ensures the document photo is genuine and hasn't been altered.
Once the information has been entered and submitted, E-Verify will compare it against millions of government records. If the information entered matches, E-Verify will return an "Employment Authorized" result. This confirms the employee is authorized to work in the United States. After printing the results page and attaching it to the employee's Form I-9 (or recording the employee's E-Verify case verification number on the form itself), the employer simply closes the case to complete the E-Verify process.
If there is a mismatch, E-Verify will return a "Tentative Nonconfirmation (TNC)" result. If this happens, the employer needs to print and review a notice with the employee that explains the cause of the mismatch and what it means for the employee.
If the employee decides to contest the mismatch, the employer will refer the case in E-Verify to the appropriate agency (either the U.S. Department of Homeland Security or Social Security Administration) and print a letter that it must give to the employee. The letter contains important instructions and contact information that the employee will need to resolve the mismatch. The employee then has eight federal government work days from the date the case was referred in E-Verify to resolve the problem.
E-Verify will alert the employer of an update in the employee's case. If the employee successfully resolves the mismatch, E-Verify will return a result of employment authorized. If the employee doesn't resolve the mismatch, E-Verify will return a final nonconfirmation result. Only after an employee receives a final nonconfirmation may an employer terminate an employee based on E-Verify.
In rare cases, the U.S. Department of Homeland Security or the Social Security Administration might need more time to verify the employee's employment eligibility.
When this happens, E-Verify will return a case in continuance result. When an employee's case is in continuance the employer must allow the employee to continue to work until E-Verify gives a final result of "Employment Authorized" or a "Final Nonconfirmation."
This page provides general information about E-Verify and is meant to provide an overview of the program. For instructions and policy guidance, visit the For Employers and For Employees sections of the website.
Business-Friendly E-Verify Features
Companies are already required by law to complete Form I-9 for each newly hired employee, and E-Verify works seamlessly with the Form I-9 process to confirm employment eligibility.
- Secure 24-hour access: Access E-Verify anytime, anywhere with no special software required. All that is needed is a Web browser and Internet access.
- Instant results: Employment eligibility results for most employees are displayed in three to five seconds.
- Error checking: E-Verify can alert employees to mismatches and possible errors in their government records. Clearing up errors sooner rather than later saves employees time and frustration down the road.
- Photo matching: E-Verify features a photo matching tool to combat document fraud and ensure the documents that employees present are genuine.
- Compliance peace of mind: Companies that properly use E-Verify get a rebuttable presumption that they are in compliance with Form I-9 and employment eligibility laws.
- User access flexibility: With two different user roles to choose from, companies can select what their users can see and do in E-Verify.
- Usage reports: E-Verify offers companies the ability to monitor usage to assist with their compliance efforts.
- Implementation flexibility: With E-Verify, companies can decide their participation on a location-by-location basis (state laws and federal regulations may limit use of this feature).
- Support for large companies: E-Verify offers features through its corporate administrator access method that allow companies to link and manage their locations that use E-Verify.
- Interactive training: E-Verify offers a comprehensive online tutorial as well as quick reference guides, user manuals and other publications to assist users.
- Customer service: You're never on your own with E-Verify. E-Verify customer support is available to provide you with technical and program assistance.
More information about E-Verify
US Citizenship and Immigration Services E-Verify resources.
Questions and Answers about E-Verify by NumbersUSA.
USCIS E-Verify Employers Search Tool. The tool is simple to use, but the biggest problem here is knowing the legal name of the company and their E-Verify address. You might call the company and ask for their company name and legal address, and while you are at it, ask if they use E-Verify. If they don't, ask how they make sure their workers are legal. Let them know it is important to you.
The federal contractor E-Verify list is not easy to use as it does not list by state or by alphabetical order. Colorado's State contractors are required to use E-Verify. See if the contractors on your bid list do business with the state.
Electoral College - The Importance of the Electoral College
[Originally published May, 2019]
If you don't understand why the Electoral College exists, you're the reason why it exists.
Colorado Gov. Polis signed the national popular vote bill into law on March 15, 2019.
First, a note on the fake news aspect. The Electoral College is established in Article II of the Constitution. By labelling the Electoral College as controversial, 9 News implicitly lends credibility to those who wish to dismantle our Constitutional Republic. Second, it is important to understand why Democrats want to abolish the electoral college.
From the article Abolish the electoral college? Dream on, Democrats, The Washington Post, November 16, 2016:
Sen. Barbara Boxer (D-Calif.), as she has before, introduced a bill this week to get rid of the electoral college. In the below post from the wee hours of the day after Election Day, we discuss why it's not happening... For the second time in 16 years, Democrats appear to have won more votes than Republicans, but lost the presidency. And while it was close in 2000, it may be a chasm in 2016....
So you can bet that are a whole bunch of Democrats right now that would like to put an end to this whole electoral college thing.
The bad news: They have virtually no power to make that happen -- and even they did have any power, it'd be immensely difficult.
The electoral college, after all, is enshrined in our Constitution, which means getting rid of it requires a constitutional amendment. That's a two-thirds vote in both the House and the Senate and the ratification of three-fourths (38) of the 50 states....
Back in 1934, a vote to abolish the electoral college failed in the Senate by just two votes. At the time, then-Sen. Alben Barkley (D-Ky.), who would later become vice president, labeled the system "useless." "The American people are qualified to elect their president by a direct vote, and I hope to see the day when they will," he said.
By 1966, Sen. Birch Bayh (D-Ind.) led hearings on the prospect of repealing the electoral college. He was a passionate advocate for the change for years. In 1979, the Senate debated a direct-election alternative, but it failed 51-48 -- shy of the two-thirds it needed.
More recent efforts have focused on workarounds, rather than repeal.
The National Popular Vote interstate compact has been assembling states who pledge to award all of their electoral votes to the winner of the national vote if and when they all combine for a majority of electoral votes (270). The effort has gained support from 11 states combining for 165 electoral votes, but so far only blue states have jumped on-board -- suggesting the red and swing state problems described above apply here too....
The Electoral College is an integral component of America's election process. From History Central: Why the Electoral College:
The Electoral College was created for two reasons. The first purpose was to create a buffer between population and the selection of a President. The second as part of the structure of the government that gave extra power to the smaller states.
The first reason that the founders created the Electoral College is hard to understand today. The founding fathers were afraid of direct election to the Presidency. They feared a tyrant could manipulate public opinion and come to power. Hamilton wrote in the Federalist Papers:
It was equally desirable, that the immediate election should be made by men most capable of analyzing the qualities adapted to the station, and acting under circumstances favorable to deliberation, and to a judicious combination of all the reasons and inducements which were proper to govern their choice. A small number of persons, selected by their fellow-citizens from the general mass, will be most likely to possess the information and discernment requisite to such complicated investigations. It was also peculiarly desirable to afford as little opportunity as possible to tumult and disorder. This evil was not least to be dreaded in the election of a magistrate, who was to have so important an agency in the administration of the government as the President of the United States. But the precautions which have been so happily concerted in the system under consideration, promise an effectual security against this mischief....
Hamilton and the other founders believed that the electors would be able to insure that only a qualified person becomes President. They believed that with the Electoral College no one would be able to manipulate the citizenry. It would act as check on an electorate that might be duped. Hamilton and the other founders did not trust the population to make the right choice. The founders also believed that the Electoral College had the advantage of being a group that met only once and thus could not be manipulated over time by foreign governments or others....
One aspect of the electoral system that is not mandated in the constitution is the fact that the winner takes all the votes in the state. Therefore it makes no difference if you win a state by 50.1% or by 80% of the vote you receive the same number of electoral votes. This can be a recipe for one individual to win some states by large pluralities and lose others by small number of votes, and thus this is an easy scenario for one candidate winning the popular vote while another winning the electoral vote. This winner take all methods used in picking electors has been decided by the states themselves. This trend took place over the course of the 19th century....
In the January 8, 2019 article, The Electoral College Must Remain, Elad Hakim states:
Rep. Steve Cohen, D-Tenn., recently introduced a proposed constitutional amendment that would eliminate the Electoral College. This was obviously done in response to the fact that Hillary Clinton lost the 2016 election despite winning nearly 3 million more votes than President Trump....
Cohen's position is clearly partisan, will almost certainly fail, and will face stiff resistance from many smaller states.
According to HistoryCentral, "[t]he Electoral College was created for two reasons. The first purpose was to create a buffer between population and the selection of a President. The second as part of the structure of the government that gave extra power to the smaller states." The first reason revolved around the possibility that a candidate could manipulate public opinion to such a great extent that it would lead him to secure the presidency. In other words, the Founders did not believe that the citizens could make the right decision on their own. Therefore, the electorate served as a system of checks and balances. This does not appear to be as much of a concern today.
The second reason, however, is still relevant. Generally speaking, the number of electorates in a given state directly correlates to the number of congressional representatives in the state. The minimum number of electorates for a given state is three. Therefore, the "value" of a vote in a smaller state with a lower population would "count" more than it would in a state with a higher population. For example, if a state had 90,000 votes and had three electorates, each electorate would represent 30,000 votes. On the other hand, a large state with 10,000,000 votes and 54 electorates would mean that each electorate would represent approximately 185,000 votes. Therefore, this system was initially used to appease the smaller states....
While the Electoral College is not perfect, it is the most legitimate system. It is in line with the intent of our forefathers, protects the smaller states, and helps to protect against the possibility that several very densely populated cities will decide the presidential election for the entire nation.
Hakim's conclusion bears repeating: The Electoral College as established in Article II of the U.S. Constitution is the most legitimate system. It protects against the likelihood that densely populated cities - that tend to vote Democrat - could decide the presidential election for the entire country.
How Does the Electoral College Actually Work? Explore the process with this seven-step graphic. The Heritage Foundation.
Election of President and Vice President, National Constitution Center.
Contingent Election of the President and Vice President by Congress: Perspectives and Contemporary Analysis, Gongressional Research Service.
What Is the Contingent Election and Voting Process? Findlaw.
Related
2016 U.S. Presidential Electoral votes by county:

Update: As the Electoral College Goes, So Goes the Constitution, by Michael M. Uhlmann, August 26, 2019:
The Framers understood the limits of simple-minded majoritarianism of the sort embraced by direct election. If elections were simply a matter of counting heads and stopping when you got to 50% plus one, we could dispense with all the checks and balances of the Constitution, including federalism, bicameralism, the separation of powers, and, yes, the Electoral College. The point of these time-honored devices, which are all part of an integral whole, is not to circumvent popular sentiment, but to shape and channel it in ways that support the principal end for which popular government is constituted: to secure the equal rights of all. Majority rule can become majority tyranny, as the wisest thinkers on politics have always known. The trick in establishing popular government is to empower the majority without endangering the rights of minorities....
Update: The Mob Is Right Outside the Constitution’s Wall, Breitbart, May 24, 2019:
On Tuesday, Nevada became the 15th state, along with the District of Columbia, to pass a measure that would grant its electoral college votes to the candidate that won the nationwide popular vote....
This movement is being led by an organization called National Popular Vote. The 501(c)(4) was co-founded by election law expert and attorney Barry Fadem and John Kaza (co-inventor of the scratch off lottery ticket).
The objective is to have a group of states that in total control 270 electoral votes (the number needed to win the presidency) form a compact wherein each of them will agree to cast those votes based on the nationwide popular vote, regardless of how their own state’s citizens voted....
Our Founding Fathers had the debate at the beginning of our nation as to how our system of election and governance would be structured. Democracy was rejected because of the well understood tendency of a majority to act as a tyrant. While much of what was created by our Founders was original, this concept wasn’t.
The critique of democracy dates back to Plato and the Republic. The demos, as they were called in Greek, couldn’t be trusted; they would just vote to satiate their voracious appetites at the expense of others or the nation at large....
In Madison’s mind, the structure of government and the process for electing the chief executive were designed to try to fragment the power of majority.
When you read Federalist 9> (Hamilton), Federalist10, and Federalist 51 (Madison), three key elements they felt existed to help give the new United States a chance for success were its population size, geographic size, and the differing interests of the independent states. Back in the late 1700’s, these factors would all make it more difficult for minority factions to attain the sort of critical mass required to do real damage....
We need these controls to prevent the very kind of efficiency in voting that can lead to majority dominance. The electoral college is one of those most fundamental controls. If we effectively neuter it through state collusion, then we move one step closer to a world our Founders feared, and that Plato described.
For those who are wondering, Plato’s next stage was total tyranny....
The Invention of the Electoral College, Consortium News, November 5, 2020.
The Founders Outsmarted the Presidential Election Fraudsters, by Gary Gindler, American Thinker, November 13, 2020:
... contrary to popular misconception, the President of the United States is not a representative of the American people. State legislators and governors are representatives of the people, and at the federal level so are the members of the House of Representatives of the United States Congress...
The President of the United States of America, according to the Constitution, represents state legislators' interests and no one else....
In building the American state, the fundamental principle was state control over the newly created federal power structure. Therefore, from the Founding Fathers' point of view, the federal government in Washington should consist of both representatives of the people (congressmen) and representatives of the state leadership – the federal President and senators. This is how the institution of the Electoral College was invented and implemented. The electors are appointed by the state legislatures, and they are the ones who elect the President of the country.
So why do American citizens need to participate in the presidential elections? Well, strictly speaking, it is not necessary. It is just that there is a long tradition in America – state legislators appoint electors in such a way that these appointments correspond to the mood of the people (in some states, this is even enshrined by law). This is a tradition, but according to the U.S. Constitution, the participation of the people in presidential elections, generally speaking, is not required. According to the Constitution, the people participate in the direct elections of their legislators, which is quite enough....
Thus, under the Constitution, state legislators have the right to generally ignore the results of the voting of citizens of their state and appoint those who they deem necessary to the Electoral College. Why did the Founding Fathers of the United States give state legislators such unprecedented power? Because most of the Founding Fathers were geniuses with impressive foresight. They did not know precisely when this would happen, but they knew it would eventually happen: the election's published results would have nothing to do with how the citizens voted....
The Electoral College is still right for America, by Rob Natelson, Complete Colorado, January 29, 2019:
... it is not true, as some claim, that the Founders acted only out of distrust of democracy. Rather, the system was a brilliant response to...
Having created a unique office, the Founders needed an adequate process for choosing its occupant. They set forth several criteria:
- The electoral process had to produce presidents competent to discharge their extensive responsibilities. Not only must the president be qualified for the job, but he must be able to exercise judgment independent of Congress and of the states. Thus, those directly choosing among the candidates should either know them personally or have reliable knowledge of their character and qualifications.
- The process should give great weight to popular preferences, while minimizing dangers of “stampeding” and other mob-like behavior.
- It should reduce the risks of foreign and other secret influence.
- It should balance state and national interests.
- It should produce presidents of national stature. A purely regional executive could tear the country apart, either by his election or by policies favoring some parts of the country at the expense of others.
- The process should discourage states from trying to increase their influence by artificially inflating their vote levels....
Did the Electoral College worked as intended in 2016? Yes and no.
It worked insofar as it denied election to Hillary Clinton, who, although the popular vote choice, was largely a regional candidate. But it failed to work insofar as state statutes prevented electors from voting for any candidates other than two widely seen as unacceptable. Those statutes also discouraged qualified people from seeking the office of presidential elector.
An end-run around the Electoral College, by Peter Skurkissm, American Thinker, February 28, 2019.
Prelude to a Revolution, National Popular Voting, by Don Mellon, Canada Free Press, March 16, 2019.
Don’t let Colorado be an Electoral College dropout, by Mike Rosen, Complete Colorado, February 5, 2019.
The One-Two Punch to Knock Out Electoral Democracy, by Michael S. Kochin, American Greatness, June 16, 2019.
Colorado Moves To Bypass Electoral College: Will Assign Electoral Votes To Popular Vote Winner, by Marc Slavo, Freedom Outpost, February 28, 2019.
Colorado Gov. Polis signs national popular vote bill into law, March 16, 2019.
See the 270 To Win website for an interactive electoral college map (included below) and electoral college maps of Historical Presidential Elections.

Video: Do You Understand the Electoral College?, by Tara Ross, PragerU.
Books:
The Indispensable Electoral College: How the Founders' Plan Saves Our Country from Mob Rule, by Tara Ross
We Elect a President: The Story of Our Electoral College, by Tara Ross.
Moving Closer to Mob Rule: No Choice, No Voice, by Ray DiLorenzo, Canada Free Press, May 25, 2019:

Exponential growth, doubling time, and the Rule of 70
Exponential growth is growth that occurs at a constant rate, such as an investment that grows at an annual 7 percent rate. The Rule of 70 provides a quick and easy way to determine how long it will take for an amount to double at a given growth rate. Simply divide the percentage number into 70 to obtain the approximate number of years required to double. A more detailed description is given below.
Populations can grow at a constant rate, thus the Rule of 70 can be used to approximate the doubling time of a population that is growing at a fixed rate of growth.
Human population has generally grown in an exponential manner throughout human history, and projections of exponential doubling times have been applicable.
Current dynamics of population growth are more complex and population growth can no longer be considered to be precisely exponential. Population issues of the 21st Century include migration and immigration, aging, Baby Boomers and the youth bulge, as well as continued population growth in developing countries - all of which result in pressure on sustaining resources and the environment.
Many countries will continue to double their population. The United States is projected to double its population this century, practically within the lifetimes of children born today. Therefore it is appropriate to reference the time in which these countries will double their population. Doubling time is perhaps the most illuminating manner of presenting population growth to the lay person. However, it should be noted that the explanations below refer to a constant rate of growth, which as we note, is not as applicable to countries now as it was in the past.
Exponential Growth
A quantity grows exponentially when its increase is proportional to what is already there. A common example is compound interest, where $100 invested at 7% per year annual compound interest will double in 10 years. Similarly, if a population grows at 7% per year, it, too, will double in 10 years.
Exponential growth has surprising consequences. $100 invested at a 7% annual return will double in 10 years to approximately $200, double in another 10 years to approximately $400, and double again in the next 10 years to approximately $800. Significant gains can be made by simply relying on exponential growth over time. One way of saying this is that the longer you wait on your investment, the faster your returns come in. In the following graph, you can see that over time, returns increase dramatically.
There are also clear disadvantages to exponential growth. When populations continue to grow, the impact of growth becomes increasingly significant over time. Because of the nature of exponential growth, "when things get bad, they get bad in a hurry".
Consider a city with 100,000 people, growing at 7% per year. In 10 years, the population will double to 200,000 people, in another 10 years it will double again to 400,000 people, and ten years after that it will double again to 800,000 people. The following graph shows this exponential population growth. The shape of the curve is identical to the interest rate graph above!

The Rule of 70
The Rule of 70 states that to find the doubling time of a quantity growing at a given annual percentage rate, divide the percentage number into 70 to obtain the approximate number of years required to double. For example, at a 10% annual growth rate, doubling time is 70 / 10 = 7 years.
Similarly, to get the annual growth rate, divide 70 by the doubling time. For example, 70 / 14 years doubling time = 5, or a 5% annual growth rate.
Doubling times
The following table shows some common doubling times:
| Growth Rate (% per year) |
Doubling Time in years |
| 0.1 | 700 |
| 0.5 | 140 |
| 1 | 70 |
| 2 | 35 |
| 3 | 23 |
| 4 | 18 |
| 5 | 14 |
| 6 | 12 |
| 7 | 10 |
| 10 | 7 |
Understanding Exponential Growth

See this interesting interactive tutorial on Understanding Exponential Growth.
The Math Behind the Rule of 70
From Dick Schneider, Californians for Population Stabilization:
The use of natural logs arises from integrating the basic differential equation for exponential growth: dN/dt = rN, over the period from t=0 to t = the time period in question, where N is the quantity growing and r is the growth rate.
The integral of that equation is:
N(t) = N(0) x ert
where N(t) is the size of a quantity after t intervals have elapsed, N(0) is the initial value of the quantity, e is the base of the natural logarithm, r is the average growth rate over the interval in question, and t is the number of intervals. Natural logarithms (that is, logarithms to the base e) come in from this integration. Natural logs are sometimes abbreviated ln to distinguish them from "common" logarithms of base 10.
In our case, t is usually given in years and r is the average annual growth rate. However, the formula works for seconds, weeks, centuries, etc.
The ratio of the final to the initial values of N is N(t)/N(0), and is equal to ert power. (Dividing through by N(0).)
The natural logarithm of the ratio N(t)/N(0) is equal to rt. (Taking the natural log of e raised to a power is simply the power itself.)
The growth rate r is then given by natural log N(t)/N(0) divided by t.
Alternatively, if one knows the final and initial values of N and the average growth rate, one can find the time it takes at that average growth rate for the quantity to grow from its initial value to the final value.
t = ln [ N(t)/N(0) ] / r
A special case is the doubling time, which is the time when N(t)/N(0) = 2, that is the quantity has doubled from its initial value. At that point
rt = ln 2 = 0.69
If one knows the growth rate as a decimal fraction, then the doubling time t2 = 0.69 / r.
If the growth rate is given in percent, then 0.69 must be multiplied by 100, and the doubling time = 69/r. This is the origin of the rule of 70, i.e., 69 is rounded up to 70.
For the results to be accurate, all of these calculations assume that the growth rate remains unchanged throughout the interval in question, that is, that the growth is exponential at the average rate for the entire period. Most quantities don't really grow that way (compound interest is an exception), so this method is generally an approximation for the real world.
When considering growth over a period of years, it is important to note that taking the natural logarithm of the ratio of the final value to the initial value and dividing by the time period in years gives the average annual growth rate.
For example, metro Denver population grew 15% from 1990 to 1996. The simple arithmetic average of growth is 2.5% per year (15% / 6 years = 2.5%/year). Strictly speaking the rule of 70 applies to exponential growth, which means that the compound average population growth rate must be divided into 70 to get the doubling time.
The compound average growth rate involves natural logarithms. To find the compound growth rate, take the natural log of the ratio of the final to the initial populations and divide this by 6 years. 15% growth means that the ratio of final to initial populations is 1.15. (The final population is 115% of the initial population, considered to be 100%; 115% / 100% = 1.15.) The natural log of 1.15 is 0.14. Dividing 0.14 by 6 years = 0.023/year, or an average geometric increase of 2.3% / year.
Finally, divide 70 by 2.3 to give a doubling time of 30 years.
Fertility and Population Momentum
US Population
China and India are the world's two most populous countries. The United States, with a population of over 315 million is the third most populated country. (See the Census Bureau population clock). The US has highest population growth rate of all industrialized countries.1
Fertility - Children per Woman
Fertility is defined as the average number of children per woman over the woman's lifetime. Fertility tends to be higher in less developed countries than in industrialized countries.
Replacement level fertility in the United States is approximately 2.1 children per woman (slightly higher than 2 because of child mortality). Women in the United States voluntarily achieved replacement level fertility in 1972. Yet US population has continued to grow because of two factors: mass immigration and population momentum.
Population Momentum
 Population momentum is the tendency for population to continue to grow even after replacement-level fertility (2.1 children per woman) has been achieved. It is caused by a relatively high concentration of people in their childbearing years - that is, by a population that is age-biased toward youth.
It takes a period of time equal to the average life expectancy (approximately three generations or 73 years in the U.S.) for a reduction in fertility to be manifested as a change in actual population numbers. The following graph shows how population keeps growing long after fertility is reduced.
U.S. fertility first dropped to slightly below replacement level fertility in 1972. Because of population momentum, however, U.S. population would have continued to increase to 255 million by 2020 - without any additional immigration - and then would have gradually declined.2,3,4
It is therefore crucial that this time delay be considered when targeting future population numbers and that steps to reduce fertility are taken sooner rather than later. Any attempt to achieve U.S. population stabilization must consider the long-term impact of both birth rates as well as immigration.
Precise definitions of terms
Fertility:
(1) The actual reproductive performance of an individual, a couple, a group, or a population. See general fertility rate.
(2) The term fertility is used instead of natality when births are put in relation with the number of women of fertile age. The fertility of a generation can be summarized by completed fertility and mean age at childbirth, whereas the total period fertility rate measures the fertility rate for the year.
General Fertility Rate: The number of live births per 1,000 women ages 15-44 or 15-49 years in a given year.
Total Fertility Rate (TFR):
(1) The average number of children that would be born alive to a woman (or group of women) during her lifetime if she were to pass through her childbearing years conforming to the age-specific fertility rates of a given year. This rate is sometimes stated as the number of children women are having today. See also gross reproduction rate and net reproduction rate.
(2) An estimate of the average number of children that would be born to each woman if the current age-specific birth rates remained constant.
(3) A hypothetical estimate of completed fertility. It indicates how many births a woman would have by the end of her reproductive life, if, for all of her childbearing years, she was to experience the age-specific birth rates for that given year. (From U.S. Census Bureau Fertility of American Women: June 2000).
References
1. Population Reference Bureau World Population Data Sheet, various years.
2. Demographer Leon Bouvier, Tulane University, www.NumbersUSA.com "U.S. Overpopulation Facts".
3. National Audubon Society Population and Habitat Campaign Fact sheet on population momentum.
How to report tax fraud, social security fraud, and illegal aliens
How to report Social Security fraud
- Use the Social Security Administration online Fraud Reporting form;
- Call the Fraud Hotline number at 1-800-269-0271 (TTY 1-866-501-2101) between 10 a.m. to 4 p.m., Monday through Friday;
- Fax the SSA at: 410-597-0118, or
-
Write to: Social Security OIG Hotline
P.O. Box 17785
Baltimore, Maryland 21235-7785.
For more information, see Reporting Social Security fraud.
How to report tax fraud
If you suspect or know of an individual or company that is not complying with tax law, you may report this activity by completing IRS Form 3949-A. You may fill out Form 3949-A online, print it and mail it to:
- Internal Revenue Service
- Fresno, CA 93888
If you do not wish to use Form 3949-A, you may send a letter to the address above. Please include the following information, if available:
- Name and address of the person you are reporting
- The taxpayer identification number (social security number for an individual or employer identification number for a business)
- A brief description of the alleged violation, including how you became aware of or obtained the information
- The years involved
- The estimated dollar amount of any unreported income
- Your name, address and daytime telephone number
Although you are not required to identify yourself, it is helpful to do so. Your identity can be kept confidential.
For more information, see How Do You Report Suspected Tax Fraud Activity?
How to report illegal aliens
If you suspect someone of being an illegal alien who snuck into our country and evaded apprehension at our border, you can quickly and easily file a report to government agencies at the (non-government) website www.ReportIllegals.com. Depending on the data you provide, ReportIllegals.com will in most cases file a report to ICE and in many cases to federal agencies such as CIS, CBP, DOL, DEA, DSS, FBI, HUD, IRS, SSA, TSA, or other foreign, federal, state, county and local governmental agencies.
To report suspected illegal aliens directly, contact:
Contact the US Citizenship and Immigration Services (CIS, formerly INS), under the Dept of Homeland Security.
You can call the CIS National Service Center at 1-800-375-5283 to find your local office to report illegal aliens. Note that the default language of this U.S. government office is some foreign language - not English! Press 1 to speak in English, the native language of the United States of America. Then press 9 to speak to a real person. They should be able to help find a local office to take the report.
Also, see the article: "How To Report Illegal Aliens - Updated DHS Version!"
IMAGE certification program
Section 274A of the Immigration and Nationality Act requires employers to verify that all employees are authorized to work and have established their identities using the Form I-9.
The IMAGE program was created in 2006, as a joint government and private sector initiative designed to build cooperative relationships that strengthen hiring practices and encourage employer compliance. The IMAGE program is is a voluntary partnership initiative between the federal government and private sector employers, designed to strengthen overall hiring practices. The program provides for employer self-compliance within the workplace, by which employers can achieve a lawful workforce via self-policing of their hiring practices.
IMAGE is a phony document detection service developed by ICE to offer assistance to employers seeking to avoid hiring illegal aliens. While the E-verify program verifies the status of newly hired employees, the IMAGE system examines older hiring records
Illegal aliens drawn to the United States in search of jobs. By law, U.S. companies face fines and owners face possible imprisonment if they violate laws related to employment and employment eligibility. The IMAGE program serves to foster improved relations with private sector employers, and to help employers to better understand their legal responsibilities when hiring.
While industry self-policing will allow ICE to focus on other aspects of its homeland security mission, the use of voluntary-only workplace enforcement has its obvious pitfalls.
IMAGE was designed as a partnership initiative between the government and private sector employers. To that end, ICE is committed to working with IMAGE participants in the following ways:
- ICE will waive potential fines if substantive violations are discovered on fewer than 50 percent of the required Forms I-9.
- In instances where more than 50 percent of the Forms I-9 contain substantive violations, ICE will mitigate fines or issue fines at the statutory minimum of $110 per violation.
- ICE will not conduct another Form I-9 inspection of the company for a two-year period.
- ICE will provide information and training before, during and after inspection.
What happens if an employer correctly complete an I-9 form and perform an E-Verify query and ICE subsequently determines the individual to be unauthorized to work in the U.S.?
- E-Verify is an Web-based system that compares information from an employee's Form I-9, Employment Eligibility Verification, to data from U.S Department of Homeland Security and Social Security Administration records to confirm employment eligibility.
If the employee presented the employer with documents that reasonably appeared to be genuine and relate to the employee presenting them, the employer can not be charged with a verification violation. This type of circumstance underscores the importance of why ICE is advocating participation in E-Verify for all employers.
Benefits of using IMAGE
- By following the prescribed steps of IMAGE, a company could lessen the likelihood of being found in violation of employment laws. IMAGE participation may be considered a mitigating factor in the determination of civil penalty (fine) amounts should they be levied.
- IMAGE membership can enhance a corporate image by associating a company with sound hiring practices.
- IMAGE helps secure the homeland by reducing opportunities to inadvertently hire unauthorized illegal alien workers.
- Public recognition of the employer's IMAGE certification;
- Avoidance of lawsuits and other legal actions resulting from unauthorized employment;
- Brand name protection;
- Fine mitigation;
- A stable workforce;
- No Form I-9 inspection for a minimum of two years;
- ICE provided training and guidance on proper hiring procedures and fraudulent document awareness
Streamlined IMAGE certification process
Under the streamlined IMAGE certification process, employers will:
- Enroll in the E-Verify program within 60 days;
- Establish a written hiring and employment eligibility verification policy that includes internal Form I-9 audits at least once per year; and
- Submit to a Form I-9 inspection.
In return, ICE agrees to:
- Waive potential fines if substantive violations are discovered on fewer than 50% of the required Forms I-9;
- In instances where more than 50% of the Forms I-9 contain substantive violations, mitigate fines or issue at the statutory minimum of $110 per violation;
- Not conduct another Form I-9 inspection of the company for a two-year period; and
- Provide information and training
IMAGE best employment practices
- Use E-Verify, the DHS employment eligibility verification program, to verify the employment eligibility of all new hires.
- Use the Social Security Number Verification Service (SSNVS) for wage reporting purposes. Make a good faith effort to correct and verify the names and Social Security numbers of the current workforce and work with employees to resolve any discrepancies.
- Establish a written hiring and employment eligibility verification policy.
- Establish an internal compliance and training program related to the hiring and employment verification process, including completion of Form I-9, how to detect fraudulent use of documents in the verification process, and how to use E-Verify and SSNVS.
- Require the Form I-9 and E-Verify process to be conducted only by individuals who have received appropriate training and include a secondary review as part of each employee's verification to minimize the potential for a single individual to subvert the process.
- Arrange for annual Form I-9 audits by an external auditing firm or a trained employee not otherwise involved in the Form I-9 process.
- Establish a procedure to report to ICE credible information of suspected criminal misconduct in the employment eligibility verification process.
- Ensure that contractors and/or subcontractors establish procedures to comply with employment eligibility verification requirements. Encourage contractors and/or subcontractors to incorporate IMAGE Best Practices and when practicable incorporate the use of E-Verify in subcontractor agreements.
- Establish a protocol for responding to letters or other information received from federal and state government agencies indicating that there is a discrepancy between the agency's information and the information provided by the employer or employee (for example, - no match? letters received from the Social Security Administration) and provide employees with an opportunity to make a good faith effort to resolve the discrepancy when it is not due to employer error.
- Establish a tip line mechanism (inbox, email, etc.) for employees to report activity relating to the employment of unauthorized workers, and a protocol for responding to credible employee tips.
- Establish and maintain appropriate policies, practices and safeguards to ensure that authorized workers are not treated differently with respect to hiring, firing, or recruitment or referral for a fee or during the Form I-9, E-Verify or SSNVS processes because of citizenship status or national origin.
- Maintain copies of any documents accepted as proof.
For more information, see ICE information on IMAGE certification.
Legal resources on immigration
This section contains legal resources on mass immigration. We are not attorneys, and this is not legal advice, but rather it is a compendium of legal information that we believe will be helpful to those dealing with immigration issues.
Here are legal resources on other sites:
Juan Mann's Frequently Asked Questions About Immigration and the Law, by Juan Mann, VDare.com, December 11, 2002
Here are additional legal resources:
18 U.S. Code § 611 - Voting by aliens
18 U.S. Code § 611 - Voting by aliens
(a) It shall be unlawful for any alien to vote in any election held solely or in part for the purpose of electing a candidate for the office of President, Vice President, Presidential elector, Member of the Senate, Member of the House of Representatives, Delegate from the District of Columbia, or Resident Commissioner, unless—
(1) the election is held partly for some other purpose;
(2) aliens are authorized to vote for such other purpose under a State constitution or statute or a local ordinance; and
(3) voting for such other purpose is conducted independently of voting for a candidate for such Federal offices, in such a manner that an alien has the opportunity to vote for such other purpose, but not an opportunity to vote for a candidate for any one or more of such Federal offices.
(b) Any person who violates this section shall be fined under this title, imprisoned not more than one year, or both.
(c) Subsection (a) does not apply to an alien if—
(1) each natural parent of the alien (or, in the case of an adopted alien, each adoptive parent of the alien) is or was a citizen (whether by birth or naturalization);
(2) the alien permanently resided in the United States prior to attaining the age of 16; and
(3) the alien reasonably believed at the time of voting in violation of such subsection that he or she was a citizen of the United States.
(Added Pub. L. 104–208, div. C, title II, § 216(a), Sept. 30, 1996, 110 Stat. 3009–572; amended Pub. L. 106–395, title II, § 201(d)(1), Oct. 30, 2000, 114 Stat. 1635.)
8 U.S. Code 1327 - Aiding or assisting certain aliens to enter
8 U.S. Code § 1327 – Aiding or assisting certain aliens to enter
Current through Pub. L. 114-38. (See Public Laws for the current Congress.) US Code:
Any person who knowingly aids or assists any alien inadmissible under section 1182(a)(2) (insofar as an alien inadmissible under such section has been convicted of an aggravated felony) or 1182(a)(3) (other than subparagraph (E) thereof) of this title to enter the United States, or who connives or conspires with any person or persons to allow, procure, or permit any such alien to enter the United States, shall be fined under title 18, or imprisoned not more than 10 years, or both.
(June 27, 1952, ch. 477, title II, ch. 8, § 277, 66 Stat. 229; Pub. L. 100–690, title VII, § 7346(a), (c)(1), Nov. 18, 1988, 102 Stat. 4471; Pub. L. 101–649, title V, § 543(b)(4), title VI, § 603(a)(16), Nov. 29, 1990, 104 Stat. 5059, 5084; Pub. L. 104–208, div. C, title III, § 308(d)(3)(A), Sept. 30, 1996, 110 Stat. 3009–617.)
CAIRCO Note
HB 1224 - Colorado Secure and Verifiable Identity Document Act
In 2003, Colorado passed the Colorado Secure and Verifiable Identity Document Act (2003 HB 1224). This was a direct result of the proliferation of the non-secure Mexican Matricula Consular ID card.
You can read the entire bill on the Colorado Legislature website: Colorado Secure and Verifiable Identity Document Act (HB03-1224). You can also read CAIRCO's synopsis of HB 1224.
Immigration and Nationality Act Section 237
The Immigration and Nationality Act Section 237 states:
In addition, some aliens enter with legal documentation and then violate the terms of their admission by taking jobs they are not authorized to take, or by overstaying their authorized period of stay in our country. The INS estimated in 1996 that about 60% of the then estimated five million illegal aliens were EWI and 40% were visa overstayers. Both types of illegal aliens are deportable under Immigration and Nationality Act Section 237 (a)(1)(B) which says:
Local Law Enforcement may cooperate with Immigration Enforcement
A review of applicable rulings shows that local law enforcement may cooperate with ICE (immigration enforcement)
Calling a decision by the 9th Circuit Court of Appeals “faulty,” the Supreme Court held that “mere police questioning [regarding one’s immigration status] does not constitute a seizure.” The Court continued its landmark ruling on this issue by stating that “the officers did not need reasonable suspicion to ask Mena for her name, date of birth, or immigration status.”...
If there were even a hint that merely asking about immigration status is discriminatory (as claimed by proponents of the proposed Ordinance), then you might expect to have had at least one dissenter in that decision: Justice Ruth Bader Ginsberg. Justice Ginsberg was general counsel of the ACLU from 1973 to 1980 and sat on its National Board of Directors from 1974 to 1980. Justice Ginsberg's joining the entire court in this decision speaks volumes about its judicial wisdom and legal common sense.
Congress expressly intended for local law enforcement to act in cases in which officers have reason to believe that an individual is in the country illegally, even though immigration law enforcement is not their primary responsibility. In 1996, Congress passed and President Clinton signed legislation that protects individual officers who act to enforce federal immigration laws, even if their departments have non-cooperation policies.
The September 8, 2005 article Local police can enforce laws on immigration, states:
No specific federal authority is needed for local officers to make such arrests, according to the 2002 memo, which came to light in a recent court case....
The Associated Press reported Thursday the 2002 memo was issued by then-Attorney Gen. John Ashcroft and his staff. It overturned a 1996 letter from Justice Department lawyers that said state and local police could enforce only criminal immigration violations, such as sneaking across a border....
Excerpts from Testimony of James Jay Carafano, Ph.D. Before the House Select Committee on Homeland Security:
Excerpts from Testimony on The 287(g) Program: Ensuring the Integrity of America’s Border Security System through Federal-State Partnerships, Kris W. Kobach, Professor of Law, University of Missouri (Kansas City) School of Law, July 27, 2005
In contrast, Section 287(g) delegates authority that is considerably broader than the power to merely arrest an alien and transfer him to ICE custody. Section 287(g) encompasses the spectrum of basic enforcement powers. Such 287(g) authority includes not only the power to arrest and transfer, but also the power to investigate immigration violations, the power to collect evidence and assemble an immigration case for prosecution or removal, the power to take custody of aliens on behalf of the federal government, and other general powers involved the routine enforcement of immigration laws. This broader enforcement authority can only be delegated to state and local law enforcement agencies through a formal Memorandum of Understanding (MOU), which effectively deputizes members of state or local law enforcement agencies to perform the “function[s] of an immigration officer.” 8 U.S.C. § 1357(g).
It has become a cliché since 9/11 to say that enhanced state-federal cooperation is essential if we are to improve our homeland security. All too often those words are devoid of real meaning. However, Section 287(g) is a program that facilitates systematic, structured cooperation with proven results. I wholeheartedly urge this Committee to support its expansion.
Excerpts from Testimony on Immigration and the Alien Gang Epidemic: Problems and Solutions, by Heather Mac Donald, Senior Fellow, Manhattan Institute for Policy Research, before the House Judiciary Subcommittee on Immigration, Border Security, and Claims, April 13, 2005:
Sanctuary laws, present in such cities as Los Angeles, New York, Chicago, Austin, Houston, and San Francisco, generally forbid local police officers from inquiring into a suspect’s immigration status or reporting it to federal authorities. Such laws place a higher priority on protecting illegal aliens from deportation than on protecting legal immigrants and citizens from assault, rape, arson, and other crimes....
Sanctuary laws violate everything we have learned about policing in the 1990s. Police departments across the country discovered that utilizing every law enforcement tool in their tool chest against criminals yielded enormous gains....
The report, State and Local Authority to Enforce Immigration Law - A Unified Approach for Stopping Terrorists, by Mr. Kris W. Kobach, Center for Immigration Studies, June, 2004, states:
Open borders and sanctuary city proponents claim illegal aliens have not violated criminal law, only civil law, and thus that this distinction makes illegal entry into the U.S. a less serious matter. The Attorney General of New York clearly points out that this is incorrect. Below is part of his letter to a New York attorney:
If state and local officers do have such authority under state law, the INA permits them to arrest an individual without a warrant where the arresting officer has probable cause to believe that the individual has committed a criminal violation of the Act. Importantly, reasonable belief that a person has committed a civil violation of the Act does not provide a valid basis for an arrest. Therefore, a person’s status as illegally present in the country, which is a civil violation of the INA, without evidence that the person illegally entered the United States (a violation of the criminal provisions of the Act), does not, perforce, provide probable cause that the person is subject to arrest for violation of any criminal provision."
"Under the Act, "illegal alien" may mean an alien who has illegally entered the country, which is a criminal offense under § 1325, or an alien who legally entered but is illegally present in the United States, which may be only a civil violation."
Thus, a definite legal distinction exists between a) evidence that a person is in the U.S. illegally, which may not have been caused by illegal entry - which is a civil violation, 2) evidence that the person has entered the U.S. illegally, which is a criminal violation.
Note that the Attorney General is stating that state and local authorities do have the authority "to make warrantless arrests for federal crimes," meaning that they can arrest people for criminal (but not civil) violations of immigration law even if no warrant has been issued.
See the relevant portion of the INA, which refers to Title 18 of the United States Code, which is titled "Crimes and Criminal Procedures".
Notes on Federal versus criminal law
The law says the following about entering this country illegally (really, it's a criminal violation):
(a) Improper time or place; avoidance of examination or inspection; misrepresentation and concealment of facts; Any alien who -
(1) enters or attempts to enter the United States at any time or place other than as designated by immigration officers, or
(2) eludes examination or inspection by immigration officers, or
(3) attempts to enter or obtains entry to the United States by a willfully false or misleading representation or the willful concealment of a material fact, shall, for the first commission of any such offense, be fined under Title 18 or imprisoned not more than six months, or both, and, for a subsequent commission of any such offense, be fined under Title 18, or imprisoned not more than two years or both."
Civil and federal crime
Being illegally in the U.S. is a civil matter. However, it is a federal crime to enter the country without inspection (EWI, USC 8 1325). A first offense can bring a fine and/or up to six months followed with deportation. A second offense (a felony) can bring up to two years and/or fine and then deportation. Thus, illegal immigration is a federal crime and a civil offense, with two separate courts.
The criminal charge will be filed by a U.S. Attorney and heard in U.S. District Court. The deportation (the removal) will then be conducted by the immigration courts, the Executive Office of Immigration Review (EOIR) before an Administration Law Judge.
Along the southern border, 95 percent of the cases get deposed of by "voluntary removal" on the part of the illegal, with no prosecutions in District Court. However, some U.S. Attorneys are indeed now filing all violations of USC 8, 1325. The U.S, Attorney in the Southern District of Texas is doing exactly that, with en masse proceedings. In Denver about one-half of detainees go through the formal deportation as outlined above.
Other commonly committed federal crimes include: the misdemeanor Failure to Carry Alien Registration. 18 USC 911, False Claim of US Citizenship, is a felony with an up to five-years in prison. Under 18 USC 1546, false document and fraud misuse on an I-9 claim is a felony.
U.S. Code Title 18 - voting
From USCIS and Alien Voting: Falling Down on the Job, ImmigrationReform.com, July 7, 2017:
With very limited exceptions, U.S. citizenship is required to vote in an American election. It is a crime for non-citizens to vote in a federal election. And aliens who do so may be charged with a crime pursuant to 18 U.S. Code Section 1611. Similarly, an alien who makes a false claim to U.S. citizenship in order to vote may be prosecuted pursuant to 18 U.S. Code Section 1015(f).
Pursuant to the terms of the Immigration and Nationality Act (INA), any alien who has voted in violation of any federal, state or local constitutional provision, statute, ordinance, or regulation is both inadmissible and deportable.
U.S. Code Title 8 - Aliens and Nationality
U.S. Code Title 8 - Aliens and Nationality says the following:
Chapter 12 - Immigration and Nationality
Subchapter II - Immigration
Part IX--Miscellaneous
(a) In general Notwithstanding any other provision of Federal, State, or local law, a Federal, State, or local government entity or official may not prohibit, or in any way restrict, any government entity or official from sending to, or receiving from, the Immigration and Naturalization Service information regarding the citizenship or immigration status, lawful or unlawful, of any individual.
(b) Additional authority of government entities Notwithstanding any other provision of Federal, State, or local law, no person or agency may prohibit, or in any way restrict, a Federal, State, or local government entity from doing any of the following with respect to information regarding the immigration status, lawful or unlawful, of any individual:
(1) Sending such information to, or requesting or receiving such information from, the Immigration and Naturalization Service.
(2) Maintaining such information.
(3) Exchanging such information with any other Federal, State, or local government entity.
(c) Obligation to respond to inquiries
The Immigration and Naturalization Service shall respond to an inquiry by a Federal, State, or local government agency, seeking to verify or ascertain the citizenship or immigration status of any individual within the jurisdiction of the agency for any purpose authorized by law, by providing the requested verification or status information.
(Pub. L. 104-208, div. C, title VI, Sec. 642, Sept. 30, 1996,110 Stat. 3009-707.)
Codification
Section was enacted as part of the Illegal Immigration Reform and Immigrant Responsibility Act of 1996, and also as part of the Omnibus Consolidated Appropriations Act, 1997, and not as part of the Immigration and Nationality Act which comprises this chapter.
U.S. Code Title 8 Section 1324a
Section 1324c states, "All officers whose duty it is to enforce criminal laws shall have authority to make arrests for a violation of any provision of this section" (affirmed U.S. v. Perez-Gonzalez 2002 Fed App 0360, 6th Circ.).
Section 1644, same title states, "No local ordinance, rule, or measure shall stop law enforcement officers from enforcement of this section" (affirmed Southern District Court of NY, U.S. v. Rudy Guiliani,1996).
U.S. Code Title 8 - In-state Tuition for Illegal Aliens
U.S. Code Title 8, Chapter 14, Subchapter II, § 1623 addresses preferential treatment of illegal aliens in higher education.
8 USC § 1623 - Limitation on eligibility for preferential treatment of aliens not lawfully present on basis of residence for higher education benefits
(a) In general
Notwithstanding any other provision of law, an alien who is not lawfully present in the United States shall not be eligible on the basis of residence within a State (or a political subdivision) for any postsecondary education benefit unless a citizen or national of the United States is eligible for such a benefit (in no less an amount, duration, and scope) without regard to whether the citizen or national is such a resident.
(b) Effective date
This section shall apply to benefits provided on or after July 1, 1998.
Source: Cornell Law School Legal Information Institute: 8 USC § 1623
U.S. Code Title 8 - Inadmissible Aliens
8 U.S. Code Title 8 Section 1182 - Inadmissible Aliens:
a) Classes of aliens ineligible for visas or admissionExcept as otherwise provided in this chapter, aliens who are inadmissible under the following paragraphs are ineligible to receive visas and ineligible to be admitted to the United States...
See Cornell University Legal Information Institute for the full text of 8 U.S. Code Title. 8 Section 1182 - Inadmissible Aliens.
U.S. Code Title 8 - Offenses
U.S. Code Title 8 Section 1324(a) - Offenses
Title 8, U.S.C. § 1324(a) defines several distinct offenses related to aliens.
Subsection 1324(a)(1)(i)-(v) prohibits alien smuggling, domestic transportation of unauthorized aliens, concealing or harboring unauthorized aliens, encouraging or inducing unauthorized aliens to enter the United States, and engaging in a conspiracy or aiding and abetting any of the preceding acts. Subsection 1324(a)(2) prohibits bringing or attempting to bring unauthorized aliens to the United States in any manner whatsoever, even at a designated port of entry. Subsection 1324(a)(3).
Harboring -- Subsection 1324(a)(1)(A)(iii) makes it an offense for any person who -- knowing or in reckless disregard of the fact that an alien has come to, entered, or remains in the United States in violation of law, conceals harbors, or shields from detection, or attempts to conceal, harbor, or shield from detection, such alien in any place, including any building or any means of transportation.
Encouraging/Inducing -- Subsection 1324(a)(1)(A)(iv) makes it an offense for any person who -- encourages or induces an alien to come to, enter, or reside in the United States, knowing or in reckless disregard of the fact that such coming to, entry, or residence is or will be in violation of law ...
Penalties -- The basic statutory maximum penalty for violating 8 U.S.C. § 1324(a)(1)(i) and (v)(I) (alien smuggling and conspiracy) is a fine under title 18, imprisonment for not more than 10 years, or both. With regard to violations of 8 U.S.C. § 1324(a)(1)(ii)-(iv) and (v)(ii), domestic transportation, harboring, encouraging/inducing, or aiding/abetting, the basic statutory maximum term of imprisonment is 5 years, unless the offense was committed for commercial advantage or private financial gain, in which case the maximum term of imprisonment is 10 years. In addition, significant enhanced penalties are provided for in violations of 8 U.S.C. § 1324(a)(1) involving serious bodily injury or placing life in jeopardy. Moreover, if the violation results in the death of any person, the defendant may be punished by death or by imprisonment for any term of years. The basic penalty for a violation of subsection 1324(a)(2) is a fine under title 18, imprisonment for not more than one year, or both, 8 U.S.C. § 1324(a)(2)(A). Enhanced penalties are provided for violations involving bringing in criminal aliens, 8 U.S.C. § 1324(a)(2)(B)(i), offenses done for commercial advantage or private financial gain, 8 U.S.C. § 1324(a)(2)(B)(ii), and violations where the alien is not presented to an immigration officer immediately upon arrival, 8 U.S.C. § 1324(a)(2)(B)(iii). A mandatory minimum three year term of imprisonment applies to first or second violations of § 1324(a)(2)(B)(i) or (B)(ii). Further enhanced punishment is provided for third or subsequent offenses.
U.S. Constitution - Invasion
America's Founders were concerned about invasion. It was mentioned it four times in the Constitution, though the term was never explicitly defined.
Article I, Section 8, Paragraph 15: The Congress shall have the Power (to) provide for calling forth the Militia to execute the Laws of the Union, suppress Insurrections and repel Invasions;
Article I, Section 9, Paragraph 2: The Privilege of the Writ of Habeas Corpus shall not be suspended, unless when in cases of Rebellion or Invasion the public Safety may require it.
Article I, Section 10, Paragraph 3: No State shall, without the Consent of Congress, lay any Duty of Tonnage, keep Troops, or Ships of War in time of Peace, enter into any agreement or Compact with another State, or with a foreign Power, or engage in War, unless actually invaded, or in such imminent Danger as will not admit of delay.
Article IV, Section 4, Paragraph 1: The United States shall guarantee to every State in this Union a Republican Form of Government, and shall protect each of them against Invasion; and on Application of the Legislature, or of the Executive (when the Legislature cannot be convened) against domestics Violence.
Colorado law on display of flags
Law on display of flags in Colorado pertains to Mexican flags in Colorado public schools.
18-11-205. Unlawful to display flag - exceptions
Statute text
(1) Any person who displays any flag other than the flag of the United States of America or the state of Colorado or any of its subdivisions, agencies, or institutions upon any state, county, municipal, or other public building or adjacent grounds within this state commits a class 1 petty offense.
(2) Any person who displays any flag other than the flag of the United States of America or the state of Colorado or any of its subdivisions, agencies, or institutions in any place where it is likely to be viewed by the public or a substantial portion thereof, knowing that under the circumstances then existing such display is likely to cause a breach of the peace, commits a class 1 petty offense.
(3) "Flag", as used in this section, means any flag, ensign, banner, standard, colors, or replica or representation thereof which is an official or commonly recognized symbol of a particular nation, state, movement, cause, or organization.
(4) (a) This section does not apply to:
(I) The display of the flag of the United Nations or the flag of a foreign nation displayed to identify persons officially representing such foreign nation or the property or premises of the person or nation;
(II) The display of an appropriate flag upon ceremonial or commemorative occasions proclaimed by the president of the United States, the governor of the state of Colorado, the board of county commissioners of any county, or the mayor or other chief executive officer of a city or town within this state;
(III) The display of the flag of any adjacent state with the flag of the state of Colorado at the ports of entry weigh stations, in recognition of the joint state port operation; or
(IV) The display of any flag or representation thereof described in subsection (1) of this section that is part of a temporary display of any instructional or historical materials not permanently affixed or attached to any part of the buildings or grounds described in subsection (1) of this section.
(b) This subsection (4) shall be an affirmative defense.
References
Source: L. 71: R&RE, p. 480, § 1. C.R.S. 1963: § 40-11-205. L. 73: p. 540, § 11. L. 93: (4) amended, p. 39, § 3, effective July 1. L. 2002: (4) amended, p. 317, § 2, effective August 7.
Cross references: For affirmative defenses generally, see §§ 18-1-407, 18-1-710, and 18-1-805; for requirement that the flag be displayed in certain state institutions, see § 27-2-108.
C.J.S. See 36A C.J.S., Flags, § 2.
Law reviews. For article, "Red Flags and the Flag", see 13 Rocky Mt. L. Rev. 47 (1940).
18-11-204. Mutilation - contempt of flag - penalty
Statute text
(1) It is unlawful for any person to mutilate, deface, defile, trample upon, burn, cut, or tear any flag in public:
(a) With intent to cast contempt or ridicule upon the flag; or
(b) With intent to outrage the sensibilities of persons liable to observe or discover the action or its results; or
(c) With intent to cause a breach of the peace or incitement to riot; or
(d) Under such circumstances that it may cause a breach of the peace or incitement to riot.
(2) "Flag", as used in this section, means any flag, ensign, banner, standard, colors, or replica or representation thereof which is an official or commonly recognized symbol of the United States of America or the state of Colorado.
(3) Any person violating the provisions of this section commits a class 3 misdemeanor.
References
Source: L. 71: R&RE, p. 480, § 1. C.R.S. 1963: § 40-11-204.
C.J.S. See 36A C.J.S., Flags, §§ 1, 2.
Law reviews. For note, "Comment: Constitutional Law -- Symbolic Speech -- Colorado Flag Desecration Statute", see 48 Den. L. J. 451 (1971). For article, "The Flag-Burning Episode: An Essay on the Constitution", see 61 U. Colo. L. Rev. 39 (1990).
Subsection (1)(a) unconstitutional. Provision of this section making it unlawful to mutilate, deface, and defile a flag of the United States with intent to cast contempt thereupon is unconstitutional upon its face because the interests it seeks to promote are contrary to the fundamental values protected by the first amendment. People v. Vaughan, 183 Colo. 40, 514 P.2d 1318 (1973).
Statute was not designed to proscribe mutilating or misusing flag per se. People v. Vaughan, 183 Colo. 40, 514 P.2d 1318 (1973).
Specific intent required. A violation of this section occurs only when the surrounding circumstances manifest the exercise of the intellect in such a manner that inferences may be drawn therefrom that the acts or conduct were done with the specific intent of casting contempt on the flag. There is no violation of this section where the proscribed acts are the result of thoughtlessness, inadvertence, accident, or the like. People v. Vaughan, 183 Colo. 40, 514 P.2d 1318 (1973).
Symbolic speech protected. Conduct, which consisted of wearing a pair of blue jeans on the seat of which a portion of the American flag had been sewn, manifested an expressive intent and a communicative content such as to be considered "symbolic speech" and consequently was protected "speech" under the first amendment. People v. Vaughan, 183 Colo. 40, 514 P.2d 1318 (1973).
Colorado law on pornography
This section presents Colorado law on pornography - which is pertinent to the Spanish language Novela porn in Denver Public Libraries.
18-7-103. Injunctions to restrain the promotion of obscene materials.
Statute text
(1) The district courts of this state and the judges thereof shall have full power, authority, and jurisdiction to enjoin the wholesale promotion, promotion, or display of obscene materials as specified in this section and to issue all necessary and proper restraining orders, injunctions, and writs and processes in connection therewith not inconsistent with this article.
(2) The district attorney of the county in which a person, firm, or corporation wholesale promotes, promotes, or displays, or is about to wholesale promote, promote, or display, or has in his, her, or its possession with intent to wholesale promote, promote, or display, or is about to acquire possession with intent to wholesale promote, promote, or display any obscene material may maintain an action for injunction against such person, firm, or corporation to prevent the wholesale promotion, promotion, or display or further wholesale promotion, promotion, or display of said material described or identified in said suit for injunction.
(3) This article shall not authorize the issuance of temporary restraining orders except where exigent circumstances require the same. In matters of exigent circumstances, the restraining order shall provide that the action must be commenced on the earliest possible date. No temporary restraining order may be issued to restrain the continued exhibitions of a motion picture being shown commercially before the public, notwithstanding the existence of exigent circumstances.
(4) No temporary restraining order or temporary injunction may be issued except after notice to the person, firm, or corporation sought to be enjoined and only after all parties have been offered or afforded an opportunity to be heard. A person, firm, or corporation shall be deemed to have been offered or afforded an opportunity to be heard if notice has been given and he, she, or it fails to appear. At such hearing, evidence shall be presented and witnesses examined.
(5) Before or after the commencement of the hearing on an application for a temporary injunction, the court may, and on motion of the party sought to be restrained shall, order the trial on the action on the merits to be advanced and consolidated with the hearing on the application. Where such hearings are not so consolidated, and a temporary injunction or restraining order is issued, the court shall hold a final hearing and a trial of the issues within one day after joinder of issue, and a decision shall be rendered within two days of the conclusion of the trial. If a final hearing is not held within one day after joinder of issue or a decision not rendered within two days of the conclusion of the trial, the injunction shall be dissolved. No temporary injunction or restraining order shall issue until after a showing of probable cause to believe that the material or display is obscene and a showing of probable success on the merits. Any such temporary injunction or restraining order shall provide that the defendant may not be punished for contempt if the material is found not to be obscene after joinder of issue, final hearing, and trial.
(6) Nothing contained in this article shall prevent the court from issuing a temporary restraining order forbidding the removing, destroying, deleting, splicing, or otherwise altering of any motion picture alleged to be obscene.
(7) Any person, firm, or corporation sought to be permanently enjoined shall be entitled to a full adversary trial of the issues within one day after the joinder of issue, and a decision shall be rendered by the court within two days of the conclusion of the trial. If the defendant in any suit for a permanent injunction filed under the terms of this article shall fail to answer or otherwise join issue within the time required to file his, her, or its answer, the court, on motion of the party applying for the injunction, shall enter a general denial for the defendant and set a date for hearing on the question raised in the suit for injunction within ten days following the entry of the general denial entered by the court. The court shall render its decision within two days after the conclusion of the hearing.
(8) In the event that a final order or judgment of injunction is entered against the person, firm, or corporation sought to be enjoined, such final order or judgment shall contain a provision directing the person, firm, or corporation to surrender to the sheriff of the county in which the action was brought any of the material described in subsection (2) of this section, and such sheriff shall be directed to seize and destroy the same six months after the entry of the said final order unless criminal proceedings or an indictment is brought before that time, in which event, said material may be used as evidence in such criminal proceeding.
(9) In any action brought as herein provided, the district attorney shall not be required to file any undertaking, bond, or security before the issuance of any injunction order provided for above, shall not be liable for costs, and shall not be liable for damages sustained by reason of the injunction order in cases where judgment is rendered in favor of the person, firm, or corporation sought to be enjoined.
(10) Every person, firm, or corporation who wholesale promotes, promotes, displays, or acquires possession with intent to wholesale promote, promote, or display any of the material described in subsection (2) of this section, after the service upon him of a summons and complaint in an action brought pursuant to this article, is chargeable with knowledge of the contents.
History
Source: L. 81: Entire part R&RE, p. 1000, § 1, effective July 1. L. 86: (1) to (5) amended, p. 783, § 3, effective April 21. L. 87: (8) and (10) amended, p. 1579, § 24, effective July 10.
Annotations
Editor's note: This section was contained in a part that was repealed and reenacted in 1981 and 1977. Provisions of this section, as it existed in 1981, are similar to those contained in 18-7-102 as said section existed in 1980, the year prior to the most recent repeal and reenactment of this part. Provisions of this section, as it existed in 1977, are similar to those contained in 18-7-103 as said section existed in 1976, the year prior to the first repeal and reenactment of this part.
Annotations
Am. Jur.2d. See 50 Am. Jur.2d, Lewdness, Indecency, and Obscenity, § 12, 15.
Law reviews. For article, "One Year Review of Criminal Law and Procedure", see 39 Dicta 81 (1962). For article, "Obscenity Law in Colorado: The Struggle to Pass a Constitutional Statute", see 60 Den. L.J. 49 (1982).
This section held constitutional. The procedures established by this statute are sufficient to satisfy due process. People v. Seven Thirty-five East Colfax, Inc., 697 P.2d 348 (Colo. 1985).
Requirement of adversary hearing. Where injunctive relief is sought which amounts to prior restraint, or where a search warrant is sought, there is required an adversary hearing, which may be on short notice, to determine whether the materials sought to be seized are in fact obscene. People ex rel. McKevitt v. Harvey, 176 Colo. 447, 491 P.2d 563 (1971) (decided under former § 40-9-19, C.R.S. 1963).
Obscenity provisions could not support injunction or criminal charge. The 1977 version of the Colorado obscenity statute could not be relied upon to support either a civil injunction or a criminal charge. People v. New Horizons, Inc., 200 Colo. 377, 616 P.2d 106 (1980) (decided under former § 18-7-102).
Letters to the Editor - List of Colorado Newspapers
Send Letters to the Editor regarding mass immigration, population, and sustainability. Letters to the Editor (LTE) should be short - approximately 150 words. However, some newspapers will publish longer letters. Opinion pieces (op-eds) are typically 700 words.
Here is an example of a well-researched and well-written 500 word LTE: Gang of Eight Bill a Disaster.
Major Colorado Newspapers
Here is where to send Letters to the Editor in Colorado - these are the major newspapers. Most newspapers require that letters the author's full name, address and daytime phone number for verification (but street address, email, and phone will not be published). Anonymous or pen name letters generally will not be accepted.
Denver: Denver Post
101 W. Colfax Ave, Denver, Colorado, 80202
303.954.1010
www.denverpost.com
Send letters to: openforum@denverpost.com
Boulder: Daily Camera
5450 Western Ave., Boulder, Colorado 80301
303.442.1202
www.dailycamera.com
Send letters to: openforum@dailycamera.com
Colorado Springs: Gazette
30 S. Prospect, Colorado Springs, Colorado 80903
719.632.5511
www.gazette.com
Send letters to opinion@gazette.com
or submit letters to the editor
Ft Collins: Coloradoan
1300 Riverside Ave., Fort Collins, Colorado 80524
www.coloradoan.com
Submit letters to the editor
Glenwood Springs: Post Independent
824 Grand Ave, Glenwood Springs, Colorado 81601
970.945.8515
www.postindependent.com
Send letters to: dmunro@postindependent.com
Glenwood Springs / Rifle: Citizen Telegram
125 West 4th Street,Suite 206, Rifle, Colorado 81650
970.384.9171
www.postindependent.com
Send letters to the Citizen Telegram: news@citizentelegram.com
Grand Junction: Free Press
145 N. Fourth St., Grand Junction, Colorado 81501
970.243.2200
www.postindependent.com
Send letters to: editor@gjfreepress.com
Grand Junction: Grand Junction Sentinel
734 S. Seventh St., Grand Junction, Colorado 81501
970.242.5050
www.gjsentinel.com
Send letters to: letters@gjsentinel.com
Or submit letters to the editor
Complete List of Colorado Newspapers
Arvada: MileHighNews.com
Aspen: Aspen Daily News
Aspen: Aspen Times
Aurora: Aurora Sentinel
Bailey: Republican and Fairplay Flume
Bayfield: Pine River Times
Berthoud: Weekly Surveyor
Boulder: Boulder County Business Report
Boulder: Boulder Dirt
Boulder: Boulder Weekly
Boulder: Colorado Daily
Boulder: Daily Camera
Brighton: Sentinel Express
Brighton: Standard Blade
Broomfield: Broomfield Enterprise
Brush: Brush News Tribune
Buena Vista: Chaffee County Times
Calhan: High Plains View
Cañon City: Daily Record
Carbondale: Carbondale Valley Journal
Castle Rock: Douglas County News Press
Cedaredge: Mountain Valley News
Colorado Springs: Business Journal
Colorado Springs: Independent
Colorado Springs: Gazette
Colorado Springs: South Side Business News
Colorado Springs: Woodmen Edition
Commerce City: Sentinel Express
Cortez: Cortez Journal
Craig: Craig Daily Press
Craig: Moffat County Morning News
Crested Butte: Crested Butte News
Crested Butte: Crested Butte Weekly
Delta: Delta County Independent
Denver: Colorado Statesman
Denver: Denver Business Journal
Denver: Denver Post
Denver: Westword
Dolores: Dolores Star
Durango: Durango Herald
Durango: Durango Telegraph
Eads: Kiowa County Press
Eagle: Eagle Valley Enterprise
Eaton: North Weld Herald
Estes Park: Estes Park Trail-Gazette
Evergreen: Canyon Courier
Fort Collins: Coloradoan
Fort Collins: Fort Collins Weekly
Fort Collins: Northern CO Business Report
Fort Lupton: Fort Lupton Express
Fort Morgan: Fort Morgan Times
Fountain: Fountain Valley News
Fowler: Fowler Tribune
Frederick: Farmer and Miner
Frisco: Summit Daily News
Glenwood Springs: Post Independent
Golden: Jefferson County Transcript
Granby: Sky-Hi News
Grand Junction: GJ Free Press
Grand Junction: Daily Sentinel
Grand Lake: Grand Lake Prospector
Greeley: Greeley Tribune
Gunnison: Country Times
Haxtun: Haxtun-Fleming Herald
Hugo: Eastern Colorado Plainsman
Johnstown: Johnstown Breeze
La Junta: AgJournalOnline
La Junta: La Junta Tribune-Democrat
Lafayette: LaFayette News
Lakewood: Jefferson Sentinel
Lakewood Lakewood Edge
Lamar: Lamar Daily News
Laporte: North Forty News
Leadville: Leadville Herald Democrat
Littleton: Centennial Citizen
Littleton Littleton Gazette
Longmont: Daily Times-Call
Loveland: Daily Reporter-Herald
Lyons: Lyons Recorder
Mancos: Mancos Times
Meeker: Rio Blanco Herald Times
Montrose: Montrose Daily Press
Nederland: Mountain Ear
Norwood: Norwood Post
Ouray: Ouray News
Pagosa Springs: Pogosa Springs Daily Post
Pagosa Springs: Pagosa Springs Sun
Palisade: Palisade Tribune
Paonia: High Country News
Pueblo: Pueblo Chieftain
Rangely: Rangely Herald Times
Rico: Rico Bugle
Rifle: Citizen Telegram
Saguache: Saguache Crescent
Salida: Mountain Mail
Silverton: Silverton Standard
Snowmass: Snowmass Village Sun
Steamboat Springs: Steamboat Pilot
Sterling: Sterling Journal-Advocate
Telluride: Telluride Daily Planet
Telluride: Telluride Watch
Trinidad: Chronicle News
Trinidad: Trinidad Times Independent
Vail: Vail Daily
Vail: Vail Trail
Wellington: Wellington Tribune
Westcliffe: Wet Mountain Tribune
West Slope: Sunshine Express
Westcliffe: Wet Mountain Tribune
Windsor: Windsor Tribune
College Newspapers in Colorado
Colorado State Ft. Collins: Rocky Mountain Collegian
Colorado State Ft. Collins: Ram Republic
Fort Lewis College: Independent
Metropolitan State Denver: Metropolitan
University of Colorado Denver: The Advocate
University of Colorado Colorado Springs: The Scribe
University of Denver: Clarion
University of North Colorado: Mirror
Links to other websites
Here is a small collection of referenced and other websites. We are not responsible for the content of other websites - view at your own discretion.
National Organizations
- Americans for Immigration Control
- American Immigration Control Foundation
- English First
- Federation for American Immigration Reform (FAIR) - good research and reports
- Immigration Reform Law Institute (IRLI) - legal research, advice and assistance
- Negative Population Growth
- NumbersUSA.com - fax Congress for free on U.S. population/immigration issues
- Pro-English
- SUSPS - Sierra Club members supporting US Population Stabilization
- US English
Informational Websites and Organizations
- 14th Amendment and birthright citizenship
- American Border Patrol - daily news
- Americans for Better Immigration - Congressional report cards plus Presidential candidates
- Border Invasion Pictures
- Center for Immigration Studies - excellent research and reports
- Center for Immigration Truth
- DesertInvasion
- The Environmental Movement's Retreat from Advocating U.S. Population Stabilization (article)
- EcoFuture population resources
- Immivasion - immigration political cartoons
- How to report illegal aliens by VDare
- How to report illegals by Department of Homeland Security
- Limits to Growth
- Migration Policy Institute
- The Social Contract
- Society for American Sovereignty
- SprawlCity
- U.S. Census Bureau - data and population clock
- Veterans for Secure Borders
- VDare - blog and articles on immigration
- World Population Awareness
- World Population Balance
State and Regional Organizations
- Californians for Population Stabilization (California)
- Colorado Alliance for Immigration Reform (CAIRCO) (Colorado)
- Defend Colorado Now - 2006 ballot initiative to deny public services to illegals (Colorado)
- The Dustin Inman Society (Georgia)
- Floridians for Immigration Enforcement (Florida)
- Floridians for a Sustainable Population (Florida)
- IFIRE - Indiana Federation for Immigration Reform and Enforcement (Indiana)
- Midwest Coalition to Reduce Immigration (Midwest)
- Oregonians for Immigration Reform (Oregon)
- The Dustin Inman Society (Georgia)
- US Border Patrol Tucson Sector Local 2544 (Arizona)
Personal websites
Contact elected officials
- How to contact Colorado state legislators in your district / city / county
- How to contact your US Senators and Representative from Colorado
- NumbersUSA.com - fax Congress for free on immigration issues
- Americans for Better Immigration - Congressional immigration voting records and contact info
- FAIR - look up your Congressperson
- Congress.org - look up and contact your elected officials
- Congress.gov - find your Congressperson
- FirstGov.gov U.S. Government official web portal
- Government Guide - U.S. and local elected officials
- U.S. House of Representatives - U.S. Congress (House and Senate) 800-648-3516, 877-762-8762, 202-224-3121, 202-225-3121.
- U.S. Senate
- Project Vote Smart - U.S. and local elected officials
- White House - President, The White House, 1600 Pennsylvania Ave. NW, Washington, DC 20500
U.S. Government information
- FirstGov.gov U.S. Government official web portal
- Department of Homeland Security - public contact line: 1-877-287-8667 or 202-282-8000
- Department of Justice - Attorney General, 950 Pennsylvania Ave., NW, Washington, DC 20530; 202-616-2777
- Office of Immigration Statistics - definitions and statistics
- Presidential Oath of Office
- Immigration statistics - Immigrants
- Thomas provides detailed information on legislation, bills, Congressional Record, committee information
- U.S. Census Bureau and private Real Estate Center - state population data derived from the Census Bureau
- U.S. Customs and Border Protection, Gloria Chavez, Public Information Office, 202-927-1422
- U.S. Library of Congress
- United States Declaration of Independence and more information
- United States Constitution with more information analysis; Bill of Rights with more information; Constitutional Amendments.
Natural Born Citizen Explained
This video by Publius Huldah explains "natural born Citizen" in Article II, Sec. 1, clause 5, US Constitution: How our first Presidents were "naturalized citizens" and had to be exempted from the "natural born citizen" (NBC) requirement; shows the common understanding of Natural Born Citizen at the time our Constitution was drafted and ratified; explains 14th Amendment citizenship; and shows why Marco Rubio and Ted Cruz are not Natural Born Citizens.
Related articles
Explained: Natural Born Citizen & Naturalized Citizen, Tim Brown, Freedom Outpost, March 1, 2016:
To understand what the term natural born citizen means, one must understand that before July 4, 1776, everyone born in the new world was born a subject of the King of England, not a citizen. In fact, our first presidents were all born as subjects of the King of England:
George Washington
John Adams
Thomas Jefferson
James Madison
James Monroe
John Quincy Adams
Andrew Jackson
William Henry Harrison
Each of these men, along with their fellow countrymen were transformed into citizens on July 4, 1776 by means of the Declaration of Independence.
So, what does that mean for those presidents according to the Constitution’s requirement that a president be a natural born citizen? It means that they were naturalized via the Declaration of Independence, which would later be written out in Article II, Section 1, Clause 5 of the US Constitution.
No Person except a natural born Citizen, or a Citizen of the United States, at the time of the Adoption of this Constitution, shall be eligible to the Office of President; neither shall any Person be eligible to that Office who shall not have attained to the Age of thirty-five Years, and been fourteen Years a Resident within the United States.
Our first presidents were simply eligible because they were citizens at the time of the adoption of the Constitution. The point is that the framers knew what a natural born citizen was and they knew they were not natural born citizens. Therefore, they had to grandfather themselves into the requirement. However, after that first generation, all subsequent presidents were required to be natural born citizens.
Instead of allowing people to define natural born citizen however they like, just as they have with Barack Hussein Obama Soetoro Soebarkah, Ted Cruz, and Marco Rubio, the framers knew what the definition was because Vattel had defined the term in his book Law of Nations. From letter and other documents, we know that Vattel’s work was studied in the universities and the framers had it in their possession when they wrote the Constitution. So, there is no doubt as to the meaning of the term natural born citizen. So, how did Vattel define natural born citizen?
The citizens are the members of the civil society; bound to this society by certain duties, and subject to its authority, they equally participate in its advantages. The natives, or natural-born citizens, are those born in the country, of parents who are citizens. As the society cannot exist and perpetuate itself otherwise than by the children of the citizens, those children naturally follow the condition of their fathers, and succeed to all their rights. The society is supposed to desire this, in consequence of what it owes to its own preservation; and it is presumed, as matter of course, that each citizen, on entering into society, reserves to his children the right of becoming members of it. The country of the fathers is therefore that of the children; and these become true citizens merely by their tacit consent. We shall soon see whether, on their coming to the years of discretion, they may renounce their right, and what they owe to the society in which they were born. I say, that, in order to be of the country, it is necessary that a person be born of a father who is a citizen; for, if he is born there of a foreigner, it will be only the place of his birth, and not his country. (Emphasis mine)
What Our Framers Knew: The Constitution, Vattel, and “Natural Born Citizen”. Publius Huldah, September 29, 2014.
A version of this article appeared as: What Our Framers Knew: The Constitution, Vattel, and “Natural Born Citizen”, The Washington Standard, July 9, 2015.
The Difference Between a U.S. Citizen and a Natural Born Citizen, Lawrence Sellin, Ph.D., D.C. Clothesline, January 10, 2015:
Many members of the political-media establishment are either deliberately misrepresenting facts for political reasons or they are simply ignorant of those facts, that is, the manner in which one becomes a citizen as opposed to the concept of natural born citizenship.
Those who equate “citizen” with “natural born citizen” often misinterpret Constitutional law and statute law, the latter meaning that Congress may pass laws only defining the manner in which one becomes a citizen, either citizen by birth or a naturalized citizen, not the Constitutional concept of natural born citizenship.
In addition, many people mistakenly cite English Common Law as the origin of the natural born citizen concept, which, in that regard, the Founders rejected; rather than its true origin, the codification of natural law described by Emerich de Vattel in his 1758 book “The Law of Nations.”...
As understood by the Founders and as applied to the U.S. Constitution, the term “natural born citizen” derived its meaning less from English Common Law, than from Vattel’s “The Law of Nations.”
They knew from reading Vattel that a “natural born citizen” had a different standard from just “citizen,” for he or she was a child born in the country to two citizen parents (Vattel, Section 212 in original French and English translation).
That is the definition of a “natural born citizen,” as recognized by numerous U.S. Supreme Court and lower court decisions...
Ted Cruz is NOT ELIGIBLE to be POTUS, nor is Rubio: Confirmed, Intellihub, February 25, 2016:
As per the definition used by the original framers of the U.S. Constitution, ratified on July 4, 1776, Republican Presidential Candidate Ted Cruz can in no way be eligible to hold the seat of President of the United States and should be considered nothing less than an illegal foreign entity attempting to breach and or ‘salt’ the White House via Canada and or Cuba.
In fact, not only was Rafael Edward Cruz, A.K.A. Ted Cruz, himself born outside of the U.S., but so was his father Rafael Bienvenido, making his campaign one-hundred percent null and void...
Indeed one could argue that Cruz doesn’t have to be born inside the U.S. to be president which is technically true, but this instance is only valid if Cruz’s father were to be a “natural born citizen” as laid out by the renown Emer de Vattel in his 1758 book Law of Nations. But that’s just it — Ted Cruz’s father was not a “natural born citizen,” fully disqualifying Cruz to be the next POTUS altogether. Make no mistake, Cruz is not an eligible candidate.
However, despite the evidence, Cruz tried desperately to circumvent this issue, in an attempt to hide it from the public by filing for a “renunciation” of his Canadian citizenship on May 14, 2014...
Taking a look at the Constitution, ratified June 21, 1788, one can clearly see our forefathers intentions.
Article 2, Sec. 1, Clause 5 reads:
So the bottom line is Cruz, like Obama, was never eligible...
Moreover Marco Rubio is not a “natural born citizen” as he was born to Cuban Nationals making Rubio a “resident alien.”
Law Center Issues Threat to Ted Cruz: Quit by the 17th & Admit You’re a Fraud – Or We will Expose You as One, April 10, 2016.
Constitutional Eligibility is a Matter of National Security – The Family Time Line of Rafael Edward “Ted” Cruz, D.C. Clothesline / Freedom Outpost, April 21, 2016.
References
The Law of Nations, Or, Principles of the Law of Nature, Applied to the Conduct and Affairs of Nations and Sovereigns, with Three Early Essays on the Origin and Nature of Natural Law and on Luxury (LF ed.), Emer de Vattel, 1797 [see Sections 212-217]
Dissertation on the Manner of Acquiring the Character and Privileges of Citizen of the United States, David Ramsay, 1789
Population and Immigration Data, Projections and Graphs - Colorado
Colorado population projections
From Colorado State Fact Sheet, NPG, updated September, 2014.
Colorado population density:
People per square mile in 2000: 41.5.
People per square mile in 2010: 48.5
Census year and population:
| 1790 | 0 | 1880 | 194,327 | 1970 | 2,209,596 |
| 1800 | 0 | 1890 | 413,249 | 1980 | 2,889,735 |
| 1810 | 0 | 1900 | 539,700 | 1990 | 3,294,394 |
| 1820 | 0 | 1910 | 799,024 | 2000 | 4,301,261 |
| 1830 | 0 | 1920 | 939,629 | 2010 | 5,029,196 |
| 1840 | 0 | 1930 | 1,035,791 | ||
| 1850 | 0 | 1940 | 1,123,296 | 2030 | 5,792,357 |
| 1860 | 34,277 | 1950 | 1,325,089 | ||
| 1870 | 39,864 | 1960 | 1,753,947 |
Colorado population by county
| Population By County | Census 2010 Population | Census 2000 Population | Change from 2000 | Percent Change |
| Colorado | 5,029,196 | 4,301,261 | 727,935 | 16.92% |
(See original Colorado State Fact Sheet for complete county data.)
Colorado population data
Updated May, 2013.
Unemployment in Colorado
Additional Colorado unemployed not counted in official U3 unemployment number (April 2013 CRS report) = 108,000.
Actual total unemployed in Colorado = 95,000 + 108,000 = 203,000.
USIS estimate of number of illegal aliens in Colorado eligible for amnesty under S.744
Estimated Number of Visa Overstays in Colorado
H1-B workers in the USA ("high-tech") (3-year terms but renewable)
Data on eligible population for Deferred Action - Childhood Arrivals (DACA)
Profile of Colorado's illegal aliens population
Selected data from Profile of the Unauthorized Population: Colorado, Migration Population Instutite - analysis of 2008-2012 data:
| Demographics | Estimate | % of Total |
| Illegal alien population | 180,000 | 100% |
|
Top Countries of Birth |
||
| Mexico | 145,000 | 81% |
| Guatemala | 4,000 | 2% |
| El Salvador | 3,000 | 2% |
|
Years of U.S. Residence |
||
| Less than 5 | 34,000 | 19% |
| 5 to 9 | 53,000 | 29% |
| 10 to 14 | 52,000 | 29% |
| 15 to 19 | 21,000 | 12% |
| 20 or more | 20,000 | 11% |
|
Age |
||
| Under 16 | 15,000 | 9% |
| 16 to 24 | 32,000 | 18% |
| 25 to 34 | 58,000 | 32% |
| 35 to 44 | 45,000 | 25% |
| 45 to 54 | 20,000 | 11% |
| 55 and over | 10,000 | 6% |
|
School Enrollment of Children and Youth |
||
| Population ages 3 to 17 | 19,000 | 100% |
|
English Proficiency |
||
| Population ages 5 and older | 179,000 | 00% |
| Speak only English | 9,000 | 5% |
| Speak English "very well" | 40,000 | 22% |
| Speak English "well" | 39,000 | 22% |
| Speak English "not well"/"not at all" | 91,000 | 51 |
|
Family Income |
||
| Below 50% of the poverty level | 26,000 | 14% |
| 50-99% of the poverty level | 39,000 | 22% |
| 100-149% of the poverty level | 35,000 | 20% |
| 150-199% of the poverty level | 27,000 | 15% |
| At or above 200% of the poverty level | 53,000 | 30% |
|
Deferred Action |
||
| Childhood arrivals (DACA) | 23,000 | 13% |
Colorado's Population in 2050: A Road Paved with Good Intentions
Excerpts from the report Colorado's Population in 2050: A Road Paved with Good Intentions, by Leon F. Bouvier and Sharon McCloe Stein, NPG; originally published in Population-Environment Balance, 2001.
In 1950, Colorado's population was just over 1.3 million. By 1980, numbers were approaching 3 million. During the 1990s, the state added over one million inhabitants, or about 275 people each day. In 2000, Colorado had ballooned to 4.3 million residents. Thus, over the past 50 years, Colorado's population has more than tripled in size. In the past ten years alone, it has grown by almost one-third. There are now more people living along the Front Range than there were living in the entire state ten years ago.
What accounts for this growth? Populations grow or shrink as a result of shifts in three demographic variables: fertility, migration, and mortality. Changes in population size are dependent on net migration (people moving into the state minus people moving out of the state) and natural factors (births minus deaths). Between April 1, 1990 and July 1, 1999, natural increase in Colorado accounted for net growth of 288,209. During the same period, the Census Bureau estimates net domestic migration for Colorado at 402,832 and net international migration at 65,380. Thus, natural increase accounted for 38 percent of all growth during that period, over half came from migration from other states, and the remainder was due to migration from other countries.
In the 1990s, Colorado was home to five of the nation's ten fastest growing counties. Douglas County, the fastest growing county in the nation, almost tripled, growing from 60,000 to 176,000. Elbert County was third with a 105 percent growth rate and says it fears its population explosion will soon overwhelm the area's law enforcement, roads and bridges, and social services. Park, Custer, and Archuleta were also in the top ten.
In Summit, the sixth fastest growing county in the state, county commissioner Bill Wallace says the population growth means "we have more traffic lights and more asphalt. A lot more people commute for work. Lots that were vacant are no longer vacant. Housing is expensive. Child care is impossible to find." Even small towns are being affected. Especially on the Eastern Slope, small mountain towns and hamlets are becoming cities overnight. In Elizabeth, a town of about 1,400 people, new construction is raising concerns; one proposed development would build about 750 new homes, bringing an increase of about 1,900 people. If the political mood remains as it is today, Colorado's growth can be expected to continue and the state's population could easily reach and probably surpass the 6.4 million projected for 2025. The seven million mark, or even higher, could be reached by 2050. These numbers will impact nearly every aspect of life in Colorado.
Colorado school enrollment (K-12), which grew by 29 percent in the last decade, will continue to grow rapidly. In just ten years, the number of students could increase by over 100,000 - from 790,000 in 2000 to 900,000 in 2010. It could easily surpass one million by 2025. To maintain its 1999 student-teacher ratio, approximately 5,000 new teachers will have to be hired annually. Another 10,000 public school students per year means building at least 20 new schools every year. In Douglas County alone, a planning committee has estimated the county will need ten new schools in the next five years to keep up with its ballooning population. The Denver Rocky Mountain News reported that construction and renovation to ease overcrowding would cost 165 million to 175 million dollars.
Eleven percent of Colorado workers travel more than 40 minutes to work. If trends continue, the average metro area motorist will spend twice as much time in traffic by 2020.
During the 1990s, the population of metropolitan Denver grew from under 2 million to over 2.4 million. The Denver Regional Council of Government's (DRCOG's) growth forecast for 2020 predicts that more than one million more people will come to the metro area within the next 20 years. More than one in five of the new residents will live in Adams County, meaning Adams County will gain an average of 11,400 new residents a year. The Colorado Public Interest Research Group report on sprawl writes, "If we don't take action now, the metro Denver area is well on its way to becoming another L.A."
The Denver Post reports of pollution levels in Denver, which regularly violates the federal standards for ground-level ozone: "The brown cloud no longer is a winter phenomenon limited to Downtown, but a year-round problem blanketing the entire area." These problems extend beyond the metropolitan areas, as suburban sprawl contributes to increased air pollution throughout most of the state. Population drives water consumption as well. Colorado's fast-growing cities may eventually face water shortages unless local utilities find new supplies. The Governor's Commission on Saving Open Spaces, Farms, and Ranches found, "Rapid growth, inadequate water supply and extremely dry conditions have left cities thirsty for more water."
The Census Bureau's new projections indicate that immigration will account for two-thirds of all growth nationwide over the next century. In Colorado, most population growth comes from domestic interstate migration (people moving in from other states). Yet this is often caused by immigration (people moving in from other countries), through what is known as secondary migration. Secondary migration occurs when people leave crowded areas in search of more space. This is happening around the U.S., as massive immigration drives the native population to move to less crowded areas. Colorado has been a magnet for such migrants - notably, Californians trying to escape the effects of the states record population growth - growth that has been driven by high immigration levels. A full quarter of migration into Colorado in the past decade has come from California.
As long as federal immigration levels remain at their present non-traditional highs of nearly one million each year, the pressures that immigration puts on border states will continue to affect every state. On top of legal immigration is the pressure from illegal immigration; it is estimated that over five million illegal aliens reside in the U.S., and 300,000 new illegal aliens settle in the country each year. Colorado ranks eleventh in illegal immigration, with over 45,000 illegal aliens residing in the state as of 1996, the latest year for which numbers are available. If federal legislation limiting immigration to more traditional levels of 200,000 to 300,000 annually were passed and if illegal immigration were drastically reduced, migration levels into Colorado could be drastically reduced.
Additional information
For additional information, data, graphs, and projections, see the following:
Nativity and Place of Birth - Colorado 2000 Census, from the Colorado Demography Office. This table shows the percentage of native- and foreign-born in each Colorado city.
Colorado State Fact Sheet, NPG, updated September, 2014.
FAIR Colorado data - an extensive reference page.
Colorado's Population in 2050: A Road Paved with Good Intentions, by Leon F. Bouvier and Sharon McCloe Stein, NPG; originally published in Population-Environment Balance, 2001.
Population and Immigration Data, Projections and Graphs - United States
The following graph shows that even though the U.S. had started to achieve a stable population in 1970, mass immigration is driving our population ever upwards.
Sources: US Census Bureau; demographer Leon Bouvier;
Roy Beck, Numbers USA
The top line of the above graph shows actual US population from 1970 to 1993, and the US Census Bureau "medium projection" of total population size from 1994 to 2050. It assumes fertility, mortality, and mass immigration levels will remain similar to 1993. In fact, overall immigration has continued to rise significantly, meaning that population growth will actually be higher than shown here.
The green lower portion of the graph represents growth from 1970 Americans and their descendants. There were 203 million people living in the US in 1970. The projection of growth in 1970-stock Americans and their descendants from 1994 to 2050 is based on recent native-born fertility and mortality rates. This growth would occur despite below replacement-level fertility rates because of population momentum, where current and future children of the current generation will grow up to have their own children, all during the lifetime of the current generation. Nevertheless, this segment of Americans is on track to peak at 247 million in 2030 and then gradually decline.
The red upper portion of the graph represents the difference between the number of 1970-stock Americans and the total population. The tens of millions of people represented by this block are the immigrants who have arrived, or are projected to arrive, since 1970, plus their descendents, minus deaths. They are projected to comprise 90% of all US population growth between 1993 and 2050.
See the NumbersUSA website at www.numbersusa.com for a more thorough and interesting presentation of these facts.
The following table shows how the current level of mass immigration vastly exceeds traditional levels.
* Projections and graph courtesy Population Environment Balance, email uspop at balance dot org
Sources: US Census Bureau; Statistical Yearbook, Immigration and Naturalization Service
Averages: 178,000 per year from 1925-1965, 195,000 per year from 1921-1970
History shows the U.S. has traditionally allowed relatively small numbers to immigrate, thus allowing for decades of assimilation. After the peak of about 8.7 million in the first decade of the 20th century, numbers went steadily down. Immigration averaged only 178,000 per year from 1925 through 1965!
Posse Comitatus and placing America's military on our border
Article 4 Section 4 of the United States Constitution states:
The United States shall guarantee to every State in this Union a Republican Form of Government, and shall protect each of them against Invasion; and on Application of the Legislature, or of the Executive (when the Legislature cannot be convened) against domestic Violence.
The Posse Comitatus Act was passed in 1878 to prohibit the use of U.S. military forces to perform the tasks of civilian law enforcement - unless explicitly authorized by Congress.
The Posse Comitatus Act does not apply to the Air National Guard or the Army National Guard when they are acting in a law enforcement capacity within their own state as ordered by the governor of that state or in an adjacent state if requested by the governor of that state.
The Present can indeed place United States military on the border in an assisting role. Indeed, the President can place the military on the border to secure against invasion.
Here is more information on Posse Comitatus and placing the military on the United States border:
Exclusions and Limitations of the Posse Comitatus Act, Wikipedia:
- Army and Air National Guard units and state defense forces while under the authority of the governor of a state;
- Federal military personnel used in accordance to the Insurrection Act, as was the case during the 1992 Los Angeles riots.
- Under 18 U.S.C. § 831, the Attorney General may request that the Secretary of Defense provide emergency assistance if domestic law enforcement is inadequate to address certain types of threats involving the release of nuclear materials, such as potential use of a nuclear or radiological weapon. Such assistance may be by any personnel under the authority of the Department of Defense, provided such assistance does not adversely affect U.S. military preparedness. The only exemption is nuclear materials.
- Support roles under the Joint Special Operations Command
- Enforcement of federal law at the discretion of the President of the United States, such as with the 101st Airborne Division by President Dwight D. Eisenhower to integrate Little Rock Central High School in 1957.
18 U.S. Code § 1385 - Use of Army and Air Force as posse comitatus:
Whoever, except in cases and under circumstances expressly authorized by the Constitution or Act of Congress, willfully uses any part of the Army or the Air Force as a posse comitatus or otherwise to execute the laws shall be fined under this title or imprisoned not more than two years, or both.
The Military Can Secure the Border and Build the Wall - Why President Trump is right to call out the troops, by Daniel Greenfield, FrontPage Mag, April 4, 2018:
The United States has 14,000 troops in Afghanistan, 39,000 in Japan, 34,805 in Germany, 23,000 in South Korea, and around 5,200 in Iraq. Our military protects the borders of countless nations.
Except our own.
In 1919, we had 18,500 soldiers on the border....
If an enemy army were invading South Korea, our soldiers would swing into action. But the United States has already been invaded. The invaders have occupied and seized control of state governments, including California, while declaring that their rebel cities will defy Federal immigration law....
[President Eisenhower's] Operation Wetback was fantastically effective in clearing illegal aliens out of California and Texas....
Some commentators have claimed that the Posse Comitatus Act would prevent the use of any military forces other than the National Guard on the border. But securing the border against foreign invaders (as opposed to domestic law enforcement directed against citizens) has always been a military matter.
Furthermore the military is already authorized to operate in areas where drug smuggling occurs.
Stopping illegal migrants does not subject “citizens to the exercise of military power”. If the military does not supplement ICE, but directly secures the border, there would be no Posse Comitatus issue.
But the law also permits the use of military force to “prevent disruption of Federal functions”.
Sanctuary states like California have disrupted the functioning of immigration law and have even passed laws prohibiting citizens from cooperating with Federal authorities. 10 U.S.C. 332, “authorizes use of the militia and Armed Forces to enforce Federal law when unlawful obstructions or rebellion against the authority of the United States renders ordinary enforcement means unworkable.”
The unlawful obstruction of immigration law by sanctuary cities and states has made ordinary enforcement unworkable. The rebellion against the authority of the United States must end.
10 U.S.C. 333 further, “authorizes use of the militia and Armed Forces when domestic violence or conspiracy hinders execution of State or Federal law, and a State cannot or will not protect the constitutional rights of the citizens.” That’s the current state of affairs in California and elsewhere....
U.S. military on border would have limited role, ABC, April 3, 2018.
Posse Comitatus Act and the US Military on the Border, by Robert Longley, ThoughtCo, April 4, 2018:
The proposal brought questions of its legality under the 1878 Posse Comitatus Act. However, in 2006 and again in 2010, Presidents George W. Bush and Barack Obama took similar actions....
the Posse Comitatus Act limits the Guard troops to acting only in support of the U.S. Border Patrol, and state and local law enforcement officers....
The Posse Comitatus Act of 1878 prohibits the use of U.S. military forces to perform the tasks of civilian law enforcement such as arrest, apprehension, interrogation, and detention unless explicitly authorized by Congress.
The Posse Comitatus Act, signed into law by President Rutherford B. Hayes on June 18, 1878, limits the power of the federal government in the use of federal military personnel to enforce U.S. laws and domestic policies within the borders of the United States....
The Posse Comitatus Act does not apply to the Army National Guard and the Air National Guard when acting in a law enforcement capacity within its own state when ordered by the governor of that state or in an adjacent state if invited by that state’s governor....
Operating within the limitations of the Posse Comitatus Act, and as acknowledged by the Obama administration, National Guard troops deployed to the Mexican Border States will, as directed by the states' governors, support the Border Patrol and state and local law enforcement agencies by providing surveillance, intelligence gathering, and reconnaissance support. In addition, the troops will assist with "counternarcotics enforcement" duties until additional Border Patrol agents are trained and in place. The Guard troops may also assist in the construction of roads, fences, surveillance towers and vehicle barriers necessary to prevent illegal border crossings....
On Oct. 25, 2005, the House of Representatives and Senate enacted a joint resolution (H. CON. RES. 274) clarifying Congress' stance on the effect of the Posse Comitatus Act on the use of the military on U.S. soil. In part, the resolution states "by its express terms, the Posse Comitatus Act is not a complete barrier to the use of the Armed Forces for a range of domestic purposes, including law enforcement functions, when the use of the Armed Forces is authorized by Act of Congress or the President determines that the use of the Armed Forces is required to fulfill the President's obligations under the Constitution to respond promptly in time of war, insurrection, or other serious emergency."
The Posse Comitatus Act does not prohibit US Military on our borders, The United Patriots of America:
Myth #1 The US Constitution prohibits posting US troops on the border.
The US Constitution says no such thing. In fact, Article IV states:
Section 4. The United States shall guarantee to every state in this union a republican form of government, and shall protect each of them against invasion; and on application of the legislature, or of the executive (when the legislature cannot be convened) against domestic violence.
So the US Constitution clearly requires the federal government to protect states from invasion. Almost a million aliens illegally pouring across the border into states each year is clearly an invasion.
Myth #2 The Posse Comitatus Act prohibits US troops from guarding US borders.
This 1878 act was enacted to prevent Union troops from continuing to enforce federal laws in the defeated South after the American Civil war. Here is the text as modified by Congress in recent years:
Sec. 1385. – Use of Army and Air Force as posse comitatus
Whoever, except in cases and under circumstances expressly authorized by the Constitution or Act of Congress, willfully uses any part of the Army or the Air Force as a posse comitatus or otherwise to execute the laws shall be fined under this title or imprisoned not more than two years, or both.
Guarding US borders from foreign invasion is not “law enforcement.”
The US Army exists to defend the US from foreign invasion, which is expressly authorized by the US Constitution. Guarding the Mexican border was the Army’s primary peacetime mission until 1940, and no one ever declared this was in violation of this 1878 act....
Learn about the history and rationale for the 1878 Posse Comitatus Act
Tyranny and Posse Comitatus, by William Norman Grigg,The New American, October 31, 2016.
The Posse Comitatus Act and the United States Army: A Historical Perspective, by Matt Matthews, Combat Studies Institute Press, Fort Leavenworth, Kansas.
Appendix D: Overview of the Possee Comitatus Act, from Preparing the U.S. Army for Homeland Security Concepts, Issues, and Options, by Eric V. Larson, John E. PetersRand Corporation, 2001.
Priority Enforcement Program (PEP) and Secure Communities Program
What is the Priority Enforcement Program (PEP)?
The Department of Homeland Security’s (DHS) Priority Enforcement Program (PEP) enables DHS to work with state and local law enforcement to take custody of individuals who pose a danger to public safety before those individuals are released into our communities. PEP was established at the direction of DHS Secretary Jeh Johnson in a November 20, 2014 memorandum, entitled Secure Communities, that discontinued the Secure Communities program. PEP focuses on convicted criminals and others who pose a danger to public safety.
Under PEP, ICE will seek the transfer of a removable individual when that individual has been convicted of an offense listed under the DHS civil immigration enforcement priorities, has intentionally participated in an organized criminal gang to further the illegal activity of the gang, or poses a danger to national security.
Here is a comparison of the Secure Communities and Priority Enforcement Programs.
What was the Secure Communities Program (SCP)?
The highly effective Secure Communities Program was discontinued under the Obama administration.
Secure Communities was a program administered by U.S. Immigration and Customs Enforcement (ICE).
It was degraded to only focus its limited resources on those who have been arrested for breaking criminal laws. Simply being unlawfully present in the United States would no longer gain the attention of ICE under the Secure Communities Program.1,4
Secure Communities is a way to carry out ICE's priorities. It uses an already-existing federal information-sharing partnership between ICE and the Federal Bureau of Investigation (FBI) that helps to identify criminal aliens without imposing new or additional requirements on state and local law enforcement. For decades, local jurisdictions have shared the fingerprints of individuals who are arrested or booked into custody with the FBI to see if they have a criminal record.
Under Secure Communities, the FBI automatically sends the fingerprints to DHS to check against its immigration databases. If these checks reveal that an individual is unlawfully present in the United States or otherwise removable (can be deported) due to a criminal conviction, ICE takes enforcement action – prioritizing the removal (deporting) of individuals who present the most significant threats to public safety as determined by the severity of their crime, their criminal history, and other factors – as well as those who have repeatedly violated immigration laws.
Secure Communities imposes no new or additional requirements on state and local law enforcement. The federal government, not the state or local law enforcement agency, determines what immigration enforcement action, if any, is appropriate.
State and local jurisdictions cannot opt out of Secure Communities. A jurisdiction may choose not to receive the identifications that result from processing the fingerprints through DHS's biometric system that are provided to the local ICE field office. In the past, this option has been mischaracterized as a mechanism for a jurisdiction to opt out of the program. In fact, a jurisdiction's decision not to receive this information directly does not affect whether the local ICE field office in that jurisdiction will or will not take enforcement action based on those results.2
Only federal DHS officers make immigration enforcement decisions, and they do so only after an individual is arrested for a criminal violation of local, state, or federal law, separate and apart from any violations of immigration law.
Secure Communities Program limitations under the Obama administration
The highly effective Secure Communities Program was discontinued under the Obama administration.
U.S. Immigration and Customs Enforcement (ICE) receives annual appropriations from Congress sufficient to remove a limited number of the more than 10 million [to 40 million] individuals estimated to be in the U.S. who lack lawful status or are removable because of a criminal conviction. Given this reality, ICE must set priorities.
Under the Obama administration, ICE has set clear priorities for immigration enforcement focused on identifying and removing those aliens with criminal convictions. In addition to criminal aliens, ICE focuses on recent illegal entrants, repeat violators who game the immigration system, those who fail to appear at immigration hearings, and fugitives who have already been ordered removed by an immigration judge.
Between fiscal years 2008 and 2011 the number of convicted criminals that ICE removed from the United States increased by 89 percent, while the number of non-criminals removed dropped by 29 percent - from 25 percent in 2008 to 4 percent in 2012. According to ICE, deportations of "other" (non-criminal) removable illegal aliens was only 14,674 in 2012, or 4 percent of all removals.3
Secure Communities Program deficiencies
The SCP is a purely an administrative creation and is not a program established by act of Congress. Therefore, it can be modified or discontinued by the President or Secretary of the Interior at any time.
Enforcement of the Secure Communities Program is dependent on two factors:
-
Crimes that partisan bureaucrats in the Immigration and Customs Enforcement agency consider worthy of detention and deportation. As noted above, as of first quarter 2013, this only includes violent crimes, not serial DUIs or other misdemeanors.
- Actions, if any, that local sheriffs choose to take in response to the information provided by federal authorities.
An important point is that all such decisions are purely discretionary. A local sheriff can completely ignore the information ICE provides about his jail inmates who are illegal aliens - and yet that sheriff would still be in full compliance with SCP.
For example, if the Denver County Sheriff chooses to disregard a notification that one of his jail inmates is an illegal alien who has been twice deported and is wanted for felony reentry, and the sheriff then releases that illegal alien on bond, the sheriff is not in violation of federal law.
Secure Communities Program notes
1. Secure Communities, ICE, April 1, 2013.
2. Secure Communities: Get the Facts, ICE, April 1, 2013.
3. Secure Communities Program Removal Statistics, ICE, April 1, 2013.
4. Democrats plot to betray citizens on amnesty, Tom Tancredo, March 30, 2013.
5. Map: Immigration Enforcement Activity Hubs - Secure Communities Removals by County, 2008-2015, Center for Immigration Studies, May 2015.
Quotes
Selected quotes on government, politics, and the future of Western Civilization:
Politics
Lord Acton
"Power tends to corrupt and absolute power corrupts absolutely."
John Adams
"Liberty, once lost, is lost forever."
"Our Constitution was made only for a moral and religious people. It is wholly inadequate to the government of any other."
"A government of laws, and not of men."
"When annual elections end, there slavery begins."
"You will never know how much it cost my generation to preserve your freedom. I hope you will make good use of it."
"Cities may be rebuilt, and a People reduced to Poverty, may acquire fresh Property... a Constitution of Government once changed from Freedom, can never be restored. Liberty once lost is lost forever."
"Government is instituted for the common good; for the protection, safety, prosperity, and happiness of the people; and not for profit, honor, or private interest of any one man, family, or class of men; therefore, the people alone have an incontestable, unalienable, and indefeasible right to institute government; and to reform, alter, or totally change the same, when their protection, safety, prosperity, and happiness require it."
Samuel Adams
"The liberties of our country, the freedom of our civil Constitution, are worth defending at all hazards; and it is our duty to defend them against all attacks. We have received them as a fair inheritance from our worthy ancestors: they purchased them for us with toil and danger and expense of treasure and blood, and transmitted them to us with care and diligence. It will bring an everlasting mark of infamy on the present generation, enlightened as it is, if we should suffer them to be wrested from us by violence without a struggle, or to be cheated out of them by the artifices of false and designing men."
"Our contest is not only whether we ourselves shall be free, but whether there shall be left to mankind an asylum on earth for civil and religious liberty."
"If virtue and knowledge are diffused among the people, they will never be enslaved. This will be their great security."
"Those who would give up essential liberty, to purchase a little temporary safety, deserve neither liberty nor safety."
"The Constitution shall never be construed to prevent the people of the United States who are peaceable citizens from keeping their own arms."
Omar Ahmed, director of Council on American Islamic Relations
"Islam isn't in America to be equal to any faith, but to become dominant. The Qur'an should be the highest authority in America, and Islam the only accepted religion on Earth."
Sir Humphrey Appleby
"Diplomacy is about surviving until the next century, politics is about surviving until Friday afternoon."
Aristotle
"Republics decline into democracies and democracies degenerate into despotism."
"It is also a habit of tyrants to prefer the company of aliens to that of citizens at table and in society; citizens, they feel, are enemies, but aliens will offer no opposition."
Isaac Asimov
"There is a cult of ignorance in the United States, and there has always been. The strain of anti-intellectualism has been a constant thread winding its way through our political and cultural life, nurtured by the false notion that democracy means that 'my ignorance is just as good as your knowledge.'"
Julian Assange
"Nearly every war that had started in the past 50 years, has been a result of media lies."
Stephen K. Bannon
"Ask yourself, 'What is my task and what is my purpose?' If your answer is 'to save my country,' this country will be saved."
John M. Barry, author of The Great Influenza
"When you mix politics and science, you get politics."
Frédéric Bastiat
"Everyone wants to live at the expense of the state. They forget that the state lives at the expense of everyone."
Joe Biden
"We have put together I think the most extensive and inclusive voter fraud organization in the history of American politics."
Otto von Bismark
"What we learn from History is that no one learns from History."
"Politics is the art of the possible."
Napoleon Bonaparte
"Who saves his country violates no law."
Justice Louis Brandeis
"The greatest dangers to liberty lurk in insidious encroachment by men of zeal, well-meaning but without understanding."
Pat Buchanan
"It is not true that all creeds and cultures are equally assimilable in a First World nation born of England, Christianity, and Western civilization. Race, faith, ethnicity and history leave genetic fingerprints no 'proposition nation' can erase... Race matters. Ethnicity matters. History matters."
"Every true nation is the creation of a unique people. Indeed, if America is an ideological nation grounded no deeper than the sandy soil of abstract ideas, she will not survive the storms of this century any more that the Soviet Union survived the last. "
"The custodians of 'our democracy' are failing in the most fundamental of duties of any political system - to protect and defend the people. No failed regime can justify its permanence by claiming some inherent superiority."
William F. Buckley
"America is the home of anti-Americanism."
Christopher Caldwell
"Without assimilation, you don't have immigration but invasion."
George Carlin
"Political correctness is fascism pretending to be manners."
"The obedient always think of themselves as virtuous rather than cowardly."
Tucker Carlson
"Demographic change is the key to the Democratic party's political ambitions. Let's say that again for emphasis because it is the secret to the entire immigration debate. Demographic change is the key to the Democratic party's political initiative. In order to win and maintain power, Democrats plan to change the population of the country...
Mass immigration increases the power of the Democratic Party. Period. That's the reason Democrats support it. It's the only reason.
Ben Carson
"We've been conditioned to think that only politicians can solve our problems. But at some point, maybe we will wake up and recognize that it was politicians who created our problems."
"If Americans simply choose to vote for the person who has a D or an R by their name, we will get what we deserve, which is what we have now."
"Over the course of time many Americans have forgotten that "we the people" are actually at the top of the food chain as far as authority is concerned in this nation. "
Winston Churchill
"Individual Moslems may show splendid qualities. But the influence of the religion paralyses the social development of those who follow it. No stronger retrograde force exists in the world. Far from being moribund, Mohammedanism is a militant and proselytizing faith. It has already spread throughout Central Africa, raising fearless warriors at every step; and were it not that Christianity is sheltered in the strong arms of science - the science against which it had vainly struggled - the civilization of modern Europe might fall, as fell the civilization of ancient Rome."
"There can be no doubt that socialism is inseparably interwoven with totalitarianism and the abject worship of the state. Liberty, in all its forms is challenged by the fundamental conceptions of socialism."
"You can always count on America to do the right thing, after it has exhausted all other options."
"The inherent vice of capitalism is the unequal sharing of blessings; the inherent virtue of socialism is the equal sharing of miseries."
"You have enemies? Good. That means you've stood up for something, sometime in your life."
"While the Hindu elaborates his argument, the Moslem sharpens his sword. Between these two races and creeds... the gulf is impassable."
"Men occasionally stumble over the truth, but most of them pick themselves up and hurry off as if nothing had happened."
Marcus Tullius Cicero
"A nation can survive its fools, and even the ambitious. But it cannot survive treason from within. An enemy at the gates is less formidable, for he is known and carries his banner openly. But the traitor moves amongst those within the gate freely, his sly whispers rustling through all the alleys, heard in the very halls of government itself."
Calvin Coolidge
"If all men are created equal, that is final. If they are endowed with inalienable rights, that is final. If governments derive their just powers from the consent of the governed, that is final. No advance, no progress can be made beyond these propositions. If anyone wishes to deny their truth or their soundness, the only direction in which he can proceed historically is not forward, but backward toward the time when there was no equality, no rights of the individual, no rule of the people. Those who wish to proceed in that direction can not lay claim to progress. They are reactionary. Their ideas are not more modern, but more ancient, than those of the Revolutionary fathers."
Martin Van Crevald
"Immigration is a form of war in which violence is delayed."
Nicolas Gomez Davila
"Violence is not necessary to destroy a civilization. Each civilization dies from indifference toward the unique values which created it."
Theodore Douglas
"Restriction of free thought and free speech is the most dangerous of all subversions. It is the one un-American act that could most easily defeat us."
Theodore Dalrymple
"Political correctness is communist propaganda writ small. In my study of communist societies, I came to the conclusion that the purpose of communist propaganda was not to persuade or convince, not to inform, but to humiliate; and therefore, the less it corresponded to reality the better. When people are forced to remain silent when they are being told the most obvious lies, or even worse when they are forced to repeat the lies themselves, the lose once and for all their sense of probity. To assent to obvious lies is in some small way to become evil oneself. One's standing to resist anything is thus eroded, and even destroyed. A society of emasculated liars is easy to control. I think if you examine political correctness, it has the same effect and is intended to."
Recep Tayyip Erdogan, president of Turkey
"Democracy is like a tram. You ride it until you arrive at your destination, then you step off."
Declaration of Independence
"A Prince whose character is thus marked by every act which may define a Tyrant, is unfit to be the ruler of a free people."
Dwight D. Eisenhower
"If a political party does not have its foundation in the determination to advance a cause that is right and moral, then it is not a political party. It is a conspiracy to seize power."
Sam Francis
"'Democracy,' as the neocons and the President and most others who are enthusiastic about it use the word, means the centralized leviathan state under the firm and unqualified control of the managerial bureaucracy and those political forces able to influence it."
"If the only problem with illegal immigration is that it's illegal, if you're not willing to say mass immigration by itself is a problem, then why should we have any laws against it at all?"
"The civilization that we as Whites created in Europe and America could not have developed apart from the genetic endowments of the creating people, nor is there any reason to believe that the civilization can be successfully transmitted to a different people."
Benjamin Franklin
"A republic, if you can keep it."
"Those who would give up essential Liberty, to purchase a little temporary Safety, deserve neither Liberty nor Safety."
"Freedom of speech is a principal pillar of a free government; when this support is taken away, the constitution of a free society is dissolved, and tyranny is erected on its ruins."
"Freedom is not a gift bestowed upon us by other men, but a right that belongs to us by the laws of God and nature."
"We must all hang together, or assuredly we shall all hang separately."
"Democracy is two wolves and a lamb voting on what to have for lunch. Liberty is a well armed lamb contesting the vote."
Milton Friedman
"You cannot simultaneously have free immigration and a welfare state."
"Inflation is made in Washington because only Washington can create money... What produces it is too much government spending and too much government creation of money and nothing else."
John Kenneth Galbraith
"If there must be madness, something may be said for having it on a heroic scale."
Gibbon, Decline and Fall of the Roman Empire
"The incapacity of a weak and distracted government may often assume the appearance, and produce the effects, of a treasonable correspondence with the public enemy."
Johann Wolfgang von Goethe
"None are more hopelessly enslaved than those who falsely believe they are free."
Antonio Gramsci
"Socialism is precisely the religion that must overwhelm Christianity... In the new order, Socialism will triumph by first capturing the culture via infiltration of schools, universities, churches and the media by transforming the consciousness of society."
JT Haltigan
"Leftism is the tyranny of structurlessness. Lawlessness. The abhorrence of order. That is why Leftist individuals are characterized by emotional dysregulation..."
Alexander Hamilton
"However [political parties] may now and then answer popular ends, they are likely in the course of time and things, to become potent engines, by which cunning, ambitious, and unprincipled men will be enabled to subvert the power of the people and to usurp for themselves the reins of government, destroying afterwards the very engines which have lifted them to unjust dominion."
"If it be asked, 'What is the most sacred duty and the greatest source of our security in a republic?', the answer would be, 'An inviolable respect for the Constitution and laws.'"
"When a government betrays the people by amassing too much power and becoming tyrannical, the people have no choice but to exercise their original right of self-defense - to fight the government."
"Those who stand for nothing fall for anything."
Victor Davis Hanson
"The old politics of right versus left, and Republican opposed to Democrat have now given way to a new existential struggle: Americans must choose between civilization - or its destroyers."
"In the end, perhaps the best definition of socialism is simply 'The endless war against merit.'"
Garrett Hardin
Diversity within a nation destroys unity and leads to civil wars. Immigration, a benefit during the youth of a nation, can act as a disease in its mature state. Too much internal diversity in large nations has led to violence and disintegration.
We are now in the process of destabilizing our own country through the unlimited acceptance of massive immigration. The magic words of the destabilizers are 'diversity' and 'multiculturalism.'
Henry Hazlitt
"The government has nothing to give anybody that it doesn't first take from someone else."
Georg Wilhelm Friedrich Hegel
"What experience and history teach is this - that people and governments never have learned anything from history, or acted on principles deduced from it." Misquoted as: "We learn from history that we do not learn from history."
Georg Wilhelm Friedrich Hegel
"What experience and history teach is this - that people and governments never have learned anything from history, or acted on principles deduced from it." Misquoted as: "We learn from history that we do not learn from history."
David Horowitz
"The issue is never the issue. The issue is always the revolution."
Samuel P. Huntington, The Clash of Civilizations and the Remaking of World Order
"The principal responsibility of Western leaders is not to attempt to reshape other civilizations in the image of the West, which is beyond their declining power, but to preserve, protect, and renew the unique qualities of Western civilization."
John Jay
"Providence has been pleased to give this one connected country, to one united people; a people descended from the same ancestors, speaking the same language, professing the same religion, attached to the same principles of government, very similar in their manners and customs."
Thomas Jefferson
"The price of liberty is eternal vigilance."
"What country can preserve its liberties if their rulers are not warned from time to time that their people preserve the spirit of resistance?"
"The execution of the laws is more important than the making of them."
"When government fears the people, there is liberty. When people fear the government, there is tyranny."
"Any government powerful enough to give the people all that they want is also powerful enough to take from the people all that they have."
"The problem is not that people are taxed too little, the problem is that government spends too much."
"The government will one day be corrupt and filled with liars, and the people will flock to the one that tells the truth."
"I predict future happiness for Americans, if they can prevent the government from wasting the labors of the people under the pretense of taking care of them."
"No free man shall ever be debarred the use of arms."
"Nothing is so unequal as the equal treatment of unequal people."
Barbara Jordan
"Credibility in immigration policy can be summed up in one sentence: those who should get in, get in; those who should be kept out, are kept out; and those who should not be here will be required to leave."
"It is both a right and a responsibility of a democratic society to manage immigration so that it serves the national interest."
Henry Johnson, Jr.
"One thing we forget to know is that failed states once had civil, constitutional laws that were put in place. When these laws don't work for all that's when dictatorship arises and injustices hug the land, and prosperities becomes the luxury of the few, not the masses."
John Paul Jones
"I have not yet begun to fight!"
Robert F. Kennedy, Jr.
"There is no time in history where the people who were censoring speech were the good guys."
Russell Kirk
"Conservatism is the negation of ideology: it is a state of mind, a type of character, a way of looking at the civil social order."
Henry Kissinger
"It was a grave mistake to let in so many people of totally different culture and religion and concepts, because it creates a pressure group inside each country that does that."
Viclav Klaus
"You cannot have democratic accountability in anything bigger than a nation state."
Charles Krauthammer
"To understand the workings of American politics, you have to understand this fundamental law: Conservatives think liberals are stupid. Liberals think conservatives are evil."
Milan Kundera
"The first step in liquidating a people is to erase its memory. Destroy its books, its culture, its history. Then have somebody write new books, manufacture a new culture, invent a new history. Before long that nation will begin to forget what it is and what it was... The struggle of man against power is the struggle of memory against forgetting."
Kari Lake
"When a man flees war, he takes his family with him. When a man heads to war, he leaves his family behind. Our Nation is being infiltrated by Military-Aged Men from every corner of the globe."
Gov. Dick Lamm
"It is a Blessing for an Individual to be Bilingual; It is a Curse for a Society to be Bilingual."
Vladimir Lenin
"The best way to control the opposition is to lead it ourselves."
Mark Levin
C.S. Lewis
"Of all the tyrannies, a tyranny sincerely exercised for the good of its victims may be the most oppressive... Those who torment us for our own good will torment us without end for they do so with the approval of their own conscience."
A.J. Liebling
"Freedom of the press is guaranteed only to those who own one."
Rush Limbaugh
"You know why there's a Second Amendment? In case the government fails to follow the first one."
"The biggest crime in America is the illegal invasion of this country."
"We are in a cultural war that is more important than any war that has ever been fought."
"End results that work that don't involve government threaten liberals."
"Liberals have created, and the minority leadership has exploited, a community of dependent people, unaware of the true route to prosperity and happiness: self-reliance and self-investment. Instead, people are told that America is unjust, unfair, and full of disadvantages. They are told that their only hope is for the government to fix their problems. What has happened is that generations of people have bought into this nonsense and as a result, have remained hopelessly mired in poverty and despair - because the promised solutions don't work. And they will never work - they never have.
Abraham Lincoln
"If ever I feel the soul within me elevate and expand to those dimensions not wholly unworthy of its Almighty Architect, it is when I contemplate the cause of my country deserted by all the world... and I standing up boldly and alone... hurling defiance at [our] victorious oppressors. Here, without contemplating consequences... I swear eternal fidelity to the just cause... of the land of my life, my Liberty, and my love... But if after all, we shall fail, be it so. We still shall have the proud consolation of saying to our consciences... we never faltered."
"We the people are the rightful masters of both Congress and the courts, not to overthrow the Constitution but to overthrow the men who pervert the Constitution."
James Madison
"A popular government without popular information, or the means of acquiring it, is but a prologue to a farce or a tragedy, or perhaps both."
"A well-instructed people alone can be permanently a free people."
George Mason
"To disarm the people...[i]s the most effectual way to enslave them."
Joe McCarthy
"If liberals were merely stupid, the laws of probability would dictate that at least some of their decisions would serve America's interests."
Ludwig von Mises
"There is no more dangerous menace to civilization than a government of incompetent, corrupt, or vile men."
Sen. Daniel Patrick Moynihan
"Everyone is entitled to his own opinion, but not to his own facts."
Friedrich Nietzsche
"Insanity in individuals is rare - but in groups, parties, nations, and epochs, it is the rule."
"There is a point in the history of society when it becomes so pathologically soft and tender that among other things it sides even with those who harm it, criminals, and does this quite seriously and honestly."
George Orwell
"There is no swifter route to the corruption of thought than through the corruption of language."
"In a world of deceit, telling the truth is a revolutionary act."
"Those who control the present, control the past and those who control the past control the future."
"All tyrannies rule through fraud and force, but once the fraud is exposed, they must rely exclusively on force."
"Free speech is my right to say what you don't want to hear."
"The most effective way to destroy people is to deny and obliterate their own understanding of their history."
P.J. O'Rourke
"At the core of liberalism is the spoiled child - miserable, as all spoiled children are, unsatisfied, demanding, ill-disciplined, despotic and useless. Liberalism is a philosophy of sniveling brats."
Thomas Paine
"These are the times that try men's souls; the summer soldier and the sunshine patriot will, in this crisis, shrink from the service of his country; but he that stands it now, deserves the love and thanks of man and woman."
"He who dares not offend cannot be honest."
Enoch Powell
"Free institutions are next to impossible in a country made up of different nationalities. Among a people without 'fellow-feeling', especially if they read and speak different languages, the united public opinion, necessary to the working of representative government, cannot exist."
Dennis Prager
"That is one reason 'feelings' and 'compassion' are two of the most often used liberal terms. 'Character' is no longer a liberal word because it implies self-restraint. 'Good and evil' are not liberal words either as they imply a moral standard beyond one's feelings. In assessing what position to take on moral or social questions, the liberal asks him or herself, 'How do I feel about it?' or 'How do I show the most compassion?' - not 'What is right?' or 'What is wrong?' For the liberal, right and wrong are dismissed as unknowable, and every person chooses his or her own morality."
"Given the religious nature and the emotional power of Leftist values, Jews and Christians on the Left often derive their values from the Left more than from their religion."
Ayn Rand
"A society that robs an individual of the product of his effort... is not strictly speaking a society, but a mob held together by institutionalized gang violence."
Ronald Reagan
"We dont have inflation because the people are living too well. We have inflation because the government is living too well."
"Government is not the solution to our problem, government is the problem."
"We are a nation that has a government - not the other way around."
"A nation that cannot control its borders is not a nation."
"The most terrifying words in the English language are: I'm from the government and I'm here to help."
"As government expands, liberty contracts."
"If fascism ever comes to America, it will come in the name of liberalism."
"Government's view of the economy could be summed up in a few short phrases: If it moves, tax it. If it keeps moving, regulate it. And if it stops moving, subsidize it."
"Freedom is never more than one generation away from extinction. We didn't pass it to our children in the bloodstream. It must be fought for, protected, and handed on for them to do the same, or one day we will spend our sunset years telling our children and our children's children what it was once like in the United States where men were free."
"How do you tell a Communist? Well, it's someone who reads Marx and Lenin. And how do you tell an anti-Communist? It's someone who understands Marx and Lenin."
"Government's first duty is to protect the people, not run their lives."
"Our Constitution was not written to protect the government from its people. It was written to protect the people from their government."
Theodore Roosevelt
"There is no room in this country for hyphenated Americanism. The one absolutely certain way of bringing this nation to ruin, of preventing all possibility of its continuing to be a nation at all, would be to permit it to become a tangle of squabbling nationalities."
"Christianity was saved in Europe solely because the peoples of Europe fought. If the peoples of Europe in the seventh and eighth centuries, and on up to and including the seventeenth century, had not possessed a military equality with, and gradually a growing superiority over the Mohammedans who invaded Europe, Europe would at this moment be Mohammedan and the Christian religion would be exterminated. Wherever the Mohammedans have had complete sway, wherever the Christians have been unable to resist them by the sword, Christianity has ultimately disappeared."
"There can be no fifty-fifty Americanism in this country. There is room here for only 100 percent Americanism, only for those who are Americans and nothing else."
Gad Saad
"Socialism / communism appeals to many people because on the surface it seems so 'fair, compassionate, and kind.' Of course, once you are able to think beyond that of a 5-year-old, you realize that it is the antithesis of fairness, compassion, and kindness. It is contrary to human nature, and hence it is always doomed to fail. But like the proverbial phoenix, it rises from the ashes to parasitize a new generation of imbeciles."
Carl Sagan
"Widespread intellectual and moral docility may be convenient for leaders in the short term, but it is suicidal for nations in the long term."
Evan Sayet
"Stupidity is a luxury, and you will find time and time and time and again that those who are overwhelmingly on the left are those who can afford to be."
Joseph Sobran
"Western man towers over the rest of the world in ways so large as to be almost inexpressible. It's Western exploration, science, and conquest that have revealed the world to itself. Other races feel like subjects of Western power long after colonialism, imperialism, and slavery have disappeared. The charge of racism puzzles whites who feel not hostility, but only baffled good will, because they don't grasp what it really means: humiliation. The white man presents an image of superiority even when he isn't conscious of it. And superiority excites envy. Destroying white civilization is the inmost desire of the league of designated victims we call minorities."
Alexander Solzhenitsyn
"To destroy a people, you must first sever their roots."
Thomas Sowell
"Socialism has a record so blatant that only an intellectual could ignore it or evade it."
"Blacks were not enslaved because they were black but because they were available. Slavery has existed in the world for thousands of years. Whites enslaved other Whites in Europe for centuries before the first black was brought to the Western hemisphere. Asians enslaved Europeans. Asians enslaved other Asians. Africans enslaved other Africans, and indeed even today in North Africa, blacks continue to enslave blacks."
"Envy was once considered to be one of the seven deadly sins before it became one of the most admired virtues under its new name, 'social justice'."
"It is usually futile to try to talk facts and analysis to people who are enjoying a sense of moral superiority in their ignorance."
"The oldest fraud is the belief that the political left is the party of the poor and the downtrodden."
"Those who say that all cultures are equal never explain why the results of those cultures are so grossly unequal."
"You will never understand bureaucracies until you understand that for bureaucrats procedure is everything and outcomes are nothing."
"Immigration laws are the only laws that are discussed in terms of how to help people who break them."
"The most fundamental fact about the ideas of the political left is that they do not work. Therefore we should not be surprised to find the left concentrated in institutions where ideas do not have to work in order to survive."
"Europe is belatedly discovering how unbelievably stupid it was to import millions of people from cultures that despise Western values and which often promote hatred toward the people who have let them in."
"If you are not prepared to use force to defend civilization, then be prepared to accept barbarism."
Lysander Spooner
"To ban guns because criminals use them is to tell the law abiding that their rights and liberties depend not on their own conduct, but on the conduct of the guilty and the lawless."
Joseph Stalin
"The people who cast the votes decide nothing. The people who count the votes decide everything."
Mary Steyn
"'Diversity' is one of those words designed to absolve you of the need to think. Likewise, a belief in 'multiculturalism' doesn't require you to know anything at all about other cultures, just to feel generally warm and fluffy about them."
"The pen is not mightier than the sword if your enemy is confident you will never use anything other than your pen."
President William Howard Taft
"No tendency is quite so strong in human nature as the desire to lay down rules of conduct for other people."
Sun Tzu
"An evil enemy will burn his own nation to the ground to rule over the ashes."
"The supreme art of war is to subdue the enemy without fighting."
Margaret Thatcher
"The problem with socialism is that you eventually run out of other people's money."
Alexis de Tocqueville
"I studied the Quran a great deal. I came away from that study with the conviction that by and large there have been few religions in the world as deadly to men as that of Muhammad. As far as I can see, it is the principal cause of the decadence so visible today in the Muslim world and, though less absurd than the polytheism of old, its social and political tendencies are in my opinion more to be feared, and I therefore regard it as a form of decadence rather than a form of progress in relation to paganism itself."
"Democracy and socialism have nothing in common but one word, equality. But notice the difference: while democracy seeks equality in liberty, socialism seeks equality in restraint and servitude."
Arnold Toynbee
"The U.S. will set a record in the rate of rise - and fall of an empire. Between wide open borders and fall of the dollar and growing population against a declining resource base, the US will be defeated from within. Mobs will rule the streets in the nation that is now the third largest in the world and unable to support its population except by taking resources from other countries."
"Civilizations die from suicide, not by murder."
"Of the twenty-two civilizations that have appeared in history, nineteen of them collapsed when they reached the moral state the United States is in now."
H.A. Scott Trask
"Multiculturalism is both a state religion and the ideology of the managerial class... How can the people rise up and overthrow their oppressors when there is no people, when the population is at one another's throats? Diversity is the ultimate guarantee against revolution"
Donald Trump
"This is no small thing, to restore a republic after it has fallen into corruption. It may be that our task is impossible. Yet, if we do not try then how will we know it can't be done? And if we do not try, it most certainly won't be done. The Founders' Republic, and the larger war for western civilization, will be lost."
"Fight! Fight! Fight!"
Harry S. Truman
"Once a government is committed to the principle of silencing the voice of opposition, it has only one way to go, and that is down the path of increasingly repressive measures, until it becomes a source of terror to all its citizens and creates a country where everyone lives in fear."
Mark Twain
"The man who does not read has no advantage over the man who cannot read."
"If you don't read a newspaper you are uninformed. If you read a newspaper you are misinformed."
"If voting made any difference, they wouldn't let us do it."
"The truth had no defense against a fool determined to believe a lie."
Alexander Fraser Tytler
"Democracy cannot exist as a permanent form of government. It can only exist until the voters discover they can vote themselves largesse out of the public treasure. From that moment on, the majority always votes for the candidate promising the most benefit from the public treasury, with the result that democracy always collapses over a loose fiscal policy, always to be followed by a dictatorship, and then a monarchy."
George Washington
"If the freedom of speech is taken away then dumb and silent we may be led, like sheep to the slaughter."
"A free people ought not only to be armed, but disciplined."
"Few men have virtue to withstand the highest bidder."
"Truth will ultimately prevail where pains is taken to bring it to light."
"Of all the dispositions and habits which lead to political prosperity, Religion and morality are indispensable supports."
Geert Wilders, Dutch politician
"Not all Muslims are terrorists but almost all terrorists are Muslims... I view Islam not as a religion, but as a dangerous, totalitarian ideology - equal to communism and fascism."
Walter Williams
"The founders knew that a democracy would lead to the same kind of tyranny the colonies suffered under King George III. Our founders intended for us to have a republican form of limited government... The word democracy appears in neither of our founding documents: our Declaration of Independence and Constitution."
Kevin Williamson, National Review
"Journalism is not a field marked by notably high intellectual standards, but the four-year journalism degree enables the pretense that it is a profession, like medicine, rather than a trade, like lard-rendering."
Edward O. Wilson
Regarding communism/socialism: "Great idea. Wrong species."
Growth
Al Bartlett
"The greatest shortcoming of the human race is our inability to understand the exponential function."
"Can you think of any problem in any area of human endeavor on any scale, from microscopic to global, whose long-term solution is in any demonstrable way aided, assisted, or advanced by further increases in population, locally, nationally, or globally?"
"Unlimited population growth cannot be sustained; you cannot sustain growth in the rates of consumption of resources. No species can overrun the carrying capacity of a finite land mass. This Law cannot be repealed and is not negotiable."
"Smart growth and dumb growth both destroy the environment. The only difference is that smart growth destroys the environment less rapidly than dumb growth, and smart growth destroys the environment with good taste. It's a little like buying a ticket on the Titanic. If you are smart, you go first class, and if you are dumb, or broke, you go steerage. But the end result is the same."
Norman Borlaug, winner of 1970 Nobel Peace Prize
"The green revolution has won a temporary success in man's war against hunger and deprivation; it has given man a breathing space. If fully implemented, the revolution can provide sufficient food for sustenance during the next three decades. But the frightening power of human reproduction must also be curbed; otherwise the success of the green revolution will be ephemeral only."
Kenneth Boulding
"Anyone who believes that exponential growth can go on forever in a finite world is either a madman or an economist."
David Brower
"We feel you don't have a conservation policy unless you have a population policy."
"Overpopulation is perhaps the biggest problem facing us and immigration is part of the problem it has to be addressed."
Jacques-Yves Cousteau, Oceanographer
"We must alert and organize the world's people to pressure world leaders to take specific steps to solve the two root causes of our environmental crises - exploding population growth and wasteful consumption of irreplaceable resources. Over-consumption and overpopulation underlie every environmental problem we face today."
Garrett Hardin
"A finite world can support only a finite population; therefore, population growth must eventually equal zero."
"'Sustainable growth' is an oxymoron."
"Thou shalt not transgress the carrying capacity."
"We are limited by the basic theorem of ecology, 'We can never do merely one thing'."
"Calling a ubiquitous problem a 'world problem' is useful only if there is a plausible worldwide solution."
"Overpopulation can be avoided only if borders are secure; otherwise poor and overpopulated nations will export their excess to richer and less populated nations."
"Never globalize a problem if it can possibly be dealt with locally."
"Every 'shortage' of supply is equally a 'longage' of demand."
"Of every well-meant proposal, ecologists ask a standard question: 'And then what?'"
Dr. Otis Graham
"Most Western elites continue urging the wealthy West not to stem the migrant tide [that adds 80 million net gain annually to the planet], but to absorb our global brothers and sisters until their horrid ordeal has been endured and shared by all - ten billion humans packed onto an ecologically devastated planet."
Dr. Henry W. Kendall, Nobel Laureate
"If we don't halt population growth with justice and compassion, it will be done for us by nature, brutally and without pity - and will leave a ravaged world."
James Howard Kunstler
"The cheap oil age created an artificial bubble of plentitude for a period not much longer than a human lifetime... so I hazard to assert that as oil ceases to be cheap and the world reserves move toward depletion, we will be left with an enormous population... that the ecology of the earth will not support. The journey back toward non-oil population homeostasis will not be pretty. We will discover the hard way that population hyper growth was simply a side-effect of the oil age. It was a condition, not a problem with a solution. That is what happened and we are stuck with it."
Gov. Dick Lamm
"Public policy and most of our institutions, as presently structured, assume boundless resources and no ecological limits. As a nation, we confidently proclaim that there are no limits that cannot be overcome, and around the world, endless growth also seems an assumption without challenge. It will be hard to change our thinking, but we must because we are bumping up against the reality of ecological limits. Nature has a different set of rules, and the larger ecosystem is totally indifferent to human moral codes."
Gaylord Nelson
"We have to address the population issue. The United Nations, with the U.S. supporting it, took the position in Cairo in 1994 that every country was responsible for stabilizing its own population. It can be done. But in this country, it's phony to say 'I'm for the environment but not for limiting immigration.'"
David Suzuki
"Somehow, we have come to think the whole purpose of the economy is to grow, yet growth is not a goal or purpose. The pursuit of endless growth is suicidal."
Dr. John Tanton
"The stresses caused by population growth cannot be solved by international migration. They must be confronted by and within each individual nation. Fundamental to the concept of national rights and responsibilities is the duty of each nation to match its population with its political, social, and environmental resources, in both the short and the long term."
"No nation should exceed what the biologists call its 'carrying capacity'."
Edward O. Wilson
"The raging monster upon the land is population growth. In its presence, sustainability is but a fragile theoretical construct. To say, as many do, that the difficulties of nations are not due to people, but to poor ideology and land-use management is sophistic."
"It's not the Nature of human beings to be cattle in glorified feedlots. Every person deserves the option to travel easily in and out of the complex and primal world that gave us birth. We need freedom to roam across land owned by no one but protected by all, whose unchanging horizon is the same that bounded the world of our millennial ancestors. Only in what remains of Eden, teeming with life-forms independent of us, is it possible to experience the kind of wonder that shaped the human psyche at its birth."
Walter Youngquist
"As we go from this happy hydrocarbon bubble we have reached now to a renewable energy resource economy, which we do this century, will the "civil" part of civilization survive? As we both know there is no way that alternative energy sources can supply the amount of per capita energy we enjoy now, much less for the 9 billion expected by 2050. And energy is what keeps this game going. We are involved in a Faustian bargain - selling our economic souls for the luxurious life of the moment, but sooner or later the price has to be paid."
Ethics
Rachel Carson, Silent Spring
Albert Einstein
"The world is in greater peril from those who tolerate or encourage evil than from those who actually commit it."
Mahatma Gandhi
"An error does not become truth by reason of multiplied propagation, nor does truth become error because nobody sees it. Truth stands, even if there be no public support. It is self sustained."
Garrett Hardin
"It takes five years for a willing person's mind to change. Have patience with yourself and others when treading in an area protected by a taboo."
"There is nothing more dangerous than a shallow-thinking compassionate person."
Robert A. Heinlein, Stranger in a Strange Land
"A hard, cold wisdom is required for goodness to accomplish good. Goodness without wisdom always accomplishes evil."
Abraham Joshua Heschel
"Indifference to evil is more insidious than evil itself. It is a silent justification affording evil acceptability in society."
Aldo Leopold
"A thing is right when it tends to preserve the integrity, stability, and beauty of the biotic community. It is wrong when it tends otherwise."
Peyton Conway March
"There is a wonderful mythical law of nature that the three things we crave most in life-happiness, freedom and peace of mind-are always attained by giving them to someone else."
Karl Marx
"The meaning of peace is the absence of opposition to socialism."
John Muir
"When we try to pick out anything by itself, we find it hitched to everything else in the Universe."
"Of all the paths you take in life, make sure a few of them are dirt."
"I'd rather be in the mountains thinking of God, than in church thinking about the mountains."
Plato
"Democracy leads to anarchy, which is mob rule."
"Be kind, for everyone you meet is fighting a hard battle."
Daniel Quinn
"Upwards of one hundred species... mostly of the large, slow-breeding variety... are becoming extinct here every day because more and more of the earth's carrying capacity is systematically being converted into human carrying capacity. These species are being burnt out, starved out, and squeezed out of existence... thanks to technologies that most people, I'm afraid, think of as technologies of peace."
Ayn Rand
"We can ignore reality, but we cannot ignore the consequences of ignoring reality."
Theodore Roosevelt
"To waste, to destroy, our natural resources, to skin and exhaust the land instead of using it so as to increase its usefulness, will result in undermining in the days of our children the very prosperity which we ought by rights to hand down to them."
Salman Rushdie
"Nobody has the right to not be offended. That right doesn't exist in any declaration I have ever read."
Carl Sagan
"One of the saddest lessons of history is this: If we've been bamboozled long enough, we tend to reject any evidence of the bamboozle. We're no longer interested in finding out the truth. The bamboozle has captured us. It's simply too painful to acknowledge, even to ourselves, that we've been taken..."
"You can't convince a believer of anything; for their belief is not based on evidence, it's based on a deep-seated need to believe."
Aleksandr Solzhenitsyn
"Ideology - that is what gives evil doing its long-sought justification and gives the evildoer the necessary steadfastness and determination..."
"The simple step of a courageous individual is not to take part in the lie. One word of truth outweighs the world."
Thomas Sowell
"One of the common failings among honorable people is a failure to appreciate how thoroughly dishonorable some other people can be, and how dangerous it is to trust them."
C.H. Spurgeon
"Discernment is not knowing the difference between right and wrong. It is knowing the difference between right and almost right."
Jonathan Swift
"Reasoning will never make a man correct an ill opinion, which by reasoning he never acquired."
Henry David Thoreau
"As to adopting the ways which the state has provided for remedying the evil, I know not of such ways. They take too much time, and a man's life will be gone."
"What's the use of a fine house if you don't have a planet to put it on?"
Resources
REAL ID
The REAL ID Act establishes minimum security standards for license issuance and production and prohibits Federal agencies from accepting for certain purposes driver’s licenses and identification cards from states not meeting the Act’s minimum standards. The purposes covered by the Act are: accessing Federal facilities, entering nuclear power plants, and, boarding federally regulated commercial aircraft.
The REAL ID Act was passed by Congress in 2005. It enacted the 9/11 Commission’s recommendation that the Federal Government “set standards for the issuance of sources of identification, such as driver's licenses.” The Act established minimum security standards for state-issued driver’s licenses and identification cards and prohibits Federal agencies from accepting for official purposes licenses and identification cards from states that do not meet these standards. States have made considerable progress in meeting this key recommendation of the 9/11 Commission and every state has a more secure driver’s license today than before the passage of the Act.
REAL ID does NOT apply to the following:
- Entering Federal facilities that do not require a person to present identification
- Voting or registering to vote
- Applying for or receiving Federal benefits
- Being licensed by a state to drive
- Accessing Health or life preserving services (including hospitals and health clinics), law enforcement, or constitutionally protected activities (including a defendant’s access to court proceedings)
- Participating in law enforcement proceedings or investigations
Phased implementation for air travel
-
Starting January 22, 2018, passengers with a driver’s license issued by a state that is still not compliant with the REAL ID Act (and has not been granted an extension) will need to show an alternative form of acceptable identification for domestic air travel to board their flight. To check whether your state is compliant or has an extension, click here. Passengers with driver’s licenses issued by a state that is compliant with REAL ID (or a state that has been issued an extension) will still be able to use their driver’s licenses or identification cards.
Starting January 22, 2018, travelers who do not have a license from a compliant state or a state that has been granted an extension (a complete list of non-compliant states/ territories can be found here) will be asked to provide alternate acceptable identification. If the traveler cannot provide an acceptable form of identification, they will not be permitted through the security checkpoint.
- Starting October 1, 2020, every air traveler will need a REAL ID-compliant license, or another acceptable form of identification, for domestic air travel.
REAL ID and illegal aliens
REAL ID allows compliant states to issue driver’s licenses and identification cards where the identity of the applicant cannot be assured or for whom lawful presence is not determined - e.g., illegal aliens. In fact, some states currently issue such noncompliant cards to illegal aliens. These cards must clearly state on their face (and in the machine readable zone) that it is not acceptable for official purposes and must use a unique design or color to differentiate them from compliant cards. DHS cautions against assuming that possession of a noncompliant card indicates the holder is an illegal alien, given that several states issue noncompliant licenses for reasons unrelated to lawful presence.
REAL ID and DACA
The REAL ID Act allows states to issue temporary (i.e., limited-term), REAL ID-compliant driver’s licenses and ID cards to applicants who provide valid, documentary evidence that they have “approved deferred action status.” [Sec. 202(c)(2)(B)(viii)] Under the REAL ID regulation, applicants with approved deferred action who hold valid Employment Authorization Documents (EADs) and Social Security Numbers (SSNs) may qualify to receive temporary REAL ID driver’s licenses and ID cards.
The Deferred Action for Childhood Arrival (DACA) Program standardized and expedited the process for obtaining these supporting identification documents for individuals with Deferred Action seeking REAL IDs. Individuals with approved Deferred Action, valid EADs and valid SSNs may continue to hold temporary (limited-term) REAL IDs until their expiratio. In any case, REAL ID compliant states may continue to issue noncompliant licenses and IDs to individuals with or without lawful status, including deferred action, as defined under the REAL ID Act.
More information
REAL ID Frequently Asked Questions for the Public, Department of Homeland Security.
REAL ID, Department of Homeland Security. Includes a map of state compliance with the REAL ID act.
REAL ID Documentation, Department of Homeland Security.
Race Realism
Race realism is the data-driven understanding that racial differences exist and are more than skin-deep.
In recent years, Critical Race Theory has exploded as a way of fragmenting American society into hostile identity groups. It also targets Whites as ineradicably racist and solely to blame for inequeties in outcomes of racial groups. That is, while America was founded with the explicit premise that all men are created equal, modern Marxists / leftists / progressives proclaim that all men - and all races - must be provided equal outcomes, no matter what their ability and no matter what the cost to society.
What if the entire hypothesis of systemic White racism is wrong? What if the immense societal effort to provide equal outcomes based on race is misdirected?
The following article and video address those questions in the context of race realism.
Basic Facts About Race in 13 Minutes, by Jared Taylor, American Renaissance, July 30, 2021:
Americans can’t stop talking about race and racism. Why? Because black people don’t do as well as white people. They are poorer, more likely to be in jail, they are fatter, more likely to have illegitimate children, and the black part of town is always the worst. There is only one official explanation for this. It’s the fault of white people.
But racial discrimination has been illegal for more than half a century. There are now built-in advantages for black people called affirmative action and diversity goals. That’s why Critical Race Theory now says white people are oppressing black people whether we want to or not. It’s our nature.
Is that really believable? Are we unconsciously oppressing black people? Isn’t it plausible to ask whether, on average, the different races might not have the same abilities? Couldn’t it be that most of the time in America, people of all races rise and fall according to their abilities?
At some level, almost everyone knows that races are different. The Tokyo Olympics are going on now, and I can make a prediction with complete confidence. Blacks who come originally from West Africa will dominate the sprints, and blacks who come from East Africa will dominate the long distances. It’s been that way for at a long time....
Blacks dominate professional basketball.... This book is about the physical differences that explain why blacks are tops in some sports – and not so good in others. It’s risky to talk about these physical differences, and that’s why the book is called Taboo.
It’s much more taboo to talk about race differences in intelligence, but the evidence for differences is overwhelming. You don’t have to be an expert to understand this. For example, there is no black country anywhere in the world – whether in Africa or in the Caribbean, like Haiti – that isn’t poor....
Before Europeans or Arabs showed up in black Africa, no one there had invented the wheel or any kind of mechanical device or had domesticated an animal or figured out a calendar or built a two-story building...
Here’s another pattern: There are 13,800 school districts in the United States. I don’t know of a single one that doesn’t fit the pattern on standardized tests: Black students get the worst grades. Hispanics do better than blacks. Whites do better than Hispanics. And Asians do best of all...
You may think tests of any kind – especially IQ tests – are racist, but specialists overwhelmingly agree that they are not. This book, for example, [The Nature of Human Intelligence] by Robert J. Sternberg published by Cambridge University press, is a collection of 20 chapters written by the most eminent people in the field of intelligence. Tests accurately measure the intelligence of people of all races. You are basically born with a certain level of intelligence. It’s also clear that, on average, Asians score higher than whites on every kind of test. In America, they make more money than whites, live longer, and have much lower crime rates. How does that happen if America is a white supremacist country?...
The best estimates are that genes account for 50 to 80 percent of individual differences in IQ. That means the environment accounts for the rest, but despite tremendous efforts, no one has figured out how to change the environment in ways that raise IQ permanently...
Someday, we will find the genes associated with intelligence, and I think the chances that they are equally distributed among the different races is zero. In the meantime, scientists are finding the genetic patterns associated with level of education, which is a good indirect indicator of intelligence. As you can see on this graph, those genetic patterns are distributed as we would expect: Lowest in Africans, highest in Asians....

There is even more direct evidence. People with bigger brains tend to be smarter; there is a correlation between brain size and IQ of 0.3 to 0.4....
The media hate these findings and almost never report on them. Most academics hate them.... A lot of people don’t want the truth to be known. But the truth appears to be that by and large “racism” doesn’t hold back blacks or Hispanics any more than “racism” pushes Asians ahead....
The following article is well worth reading. It's a Frequently Asked Questions [FAQ] list about how to think about race. It's a non-technical introduction to this topic that so confuses Americans:
The Race FAQ, by Steve Sailer, December 16, 2007.
Recommended reading: The Mob Comes For Madison, New Criterion, 28 December 2022: Key excerpts that reflect on race and racism in America.
Here is Gregory Hood’s speech from the 2021 American Renaissance conference. The Real Racial Reckoning. This video is available on BitChute and Brighteon, and Odysee. Gregory Hood speaks about how European-Americans are the ones with real grievances in America — as they suffer from government discrimination, media defamation, and a complete lack of political representation. Mr. Hood charged that “we have practically dismantled our entire civilization” but have received almost nothing in return. He concludes with a rousing call to action.
Related
Fighting Back Against Critical Race Theory
And a River of Racism Runs Through It
Still Think America is Racist? Watch This, by Larry Elder, Epoch Times, December 28, 2021.
The Bell Curve: Intelligence and Class Structure in American Life, by Richard J. Herrnstein, 1996.
Peter Boghossian posted a Woke Religion Taxonomy on Substack, noting that:
Michael Shellenberger and I wrote “Woke Religion: A Taxonomy” to help people understand the woke religion.
I want to be crystal clear about something: bigotry and racial discrimination are real and they have no place in society. Yes, there is ongoing racism. Yes, there is ongoing homophobia. Yes, there is ongoing hatred of trans people. These are morally abhorrent and we all need to work together to bring about their end. The woke religion, however, is not the way to stop these moral horrors. It is making our shared problems more difficult to solve.
This is the spirit in which we offer this taxonomy.
View the Woke Religion Taxonomy (pdf format). Here's an overview:

Ranked Choice Voting - RCV
Ballotpedia describes Ranked-choice voting (RCV) as:
A ranked-choice voting system (RCV) is an electoral system in which voters rank candidates by preference on their ballots...
In the most commonly used form of RCV today, sometimes called instant-runoff voting (IRV), if a candidate wins a majority of first-preference votes, he or she is declared the winner. If no candidate wins a majority of first-preference votes, the candidate with the fewest first-preference votes is eliminated. First-preference votes cast for the failed candidate are eliminated, and second-preference choices on these ballots are then elevated to first-preference. A new tally is conducted to determine whether any candidate has won a majority of the adjusted votes. The process is repeated until a candidate wins an outright majority.
Ballotpedia continues, with several examples of RCV.
What's wrong with Ranked Choice Voting (RCV)?
Thomas Buckley concludes in the article, The problem with ranked-choice voting:
... RCV is being supported by the very same forces that are intent on preserving the woke class in perpetuity and see RCV as a way to muddy the waters, confuse the public, and in fact tamp down direct participation in our governance.
Preserve Democracy notes that:
Ranked Choice Voting (RCV) is a political weapon and emerging threat to our democracy. It is a complex, multi-step process that confuses voters, escalates negativity, increases costs, and results in voter suppression...
RCV is already in 28 states. In 2023, NBC reports that legislatures in 14 states are considering expanding or implementing RCV. And Congress has introduced a bill twice before to make RCV mandatory in all 50 states for U.S. House and Senate races. If we don't act now, the entire U.S. election system is about to change.
The Foundation for Government Accountability (FGA) reported that:
Ranked-choice voting (RCV), also called 'instant runoff voting,' is portrayed as a viable alternative to the status quo, but in reality, it is a disaster. Funded by the progressive Left, RCV advocacy organizations claim that this massive overhaul can improve voter confidence by providing more candidate choices, decreasing negative campaigning, and ensuring majority rule. But these are false promises... Key Findings:
- Ballots in ranked-choice voting elections are more complex than traditional "one-person, one vote" elections.
- Exhausted ballots in ranked-choice voting races silence the voice of significant portions of the electorate.
- Districts using ranked-choice voting have lower voter turnout rates.
- Ranked-choice voting changes and delays the election counting process.
THE BOTTOM LINE: Lawmakers should ban ranked-choice voting at all levels of government.
Heritage Foundation reported in the study, Ranked Choice Voting Is a Bad Choice that:
... ranked choice voting (or "instant runoff voting") - but it is really a scheme to disconnect elections from issues and allow candidates with marginal support from voters to win elections. In the end, it is all about political power, not about what is best for the American people and for preserving our great republic. So-called reformers want to change process rules so they can manipulate election outcomes to obtain power. Key Takeaways:
- Ranked choice voting is a scheme to disconnect elections from issues and allow candidates with marginal support from voters to win.
- It obscures true debates and issue-driven dialogs among candidates and eliminates genuine binary choices between two top-tier candidates.
- It also disenfranchises voters, because ballots that do not include the two ultimate finalists are cast aside to manufacture a faux majority for the winner..
Ballot Exhaustion
How could this happen? Because of a phenomenon known as ballot exhaustion. A study published in 2015 that reviewed 600,000 votes cast using ranked choice voting in four local elections in Washington State and California found that "the winner in all four elections receive[d] less than a majority of the total votes cast."...
Many voters may only list their top two or three candidates, particularly when there are candidates on the ballot for whom they would never even consider voting.
Thus, if a voter only ranks two of the five candidates and those two are eliminated in the first and second rounds of tabulation, their choices will not be considered in the remaining rounds of tabulation. This ballot exhaustion leads to candidates being elected who were not the first choice of a majority of voters...
The report includes examples of Ranked Choice Voting, with several cautionary examples, including the Australian election of 2010, the Oakland, California 2010 election, and the Maine 2018 election. The report notes that:
Another cautionary example of Ranked Choice Voting is the 2020 Alaska gubernatorial election, where 60% of voters cast ballots for Republicans, yet a Democrat won. See the article Baked Alaskan, by Ed Morrissey.
The Center for Election Science reports in The Limits of Ranked-Choice Voting:
- What RCV Doesn't Do: Guarantee A Majority
- What RCV Doesn't Do: Properly Address Vote Splitting
- What RCV Doesn't Do: Always Let You Honestly Rank Your Favorite Candidate First
- What RCV Doesn't Do: Work In Presidential Elections
- What RCV Doesn't Do: Help Third Parties
The report also mentions monotonicity failure where ranking a candidate as better can hurt that candidate and ranking a candidate as worse can help that candidate.
Further discussion on Ranked Choice Voting
Hans von Spakovsky: Ranked Choice Voting Leads to Voter Disenfranchisement:
Ranked Choice Voting Explained: Confusing, Chaotic Election "Reform" Pushed by Leftist Donors, Heritage Foundation, June 2023:
Ranked-choice voting (RCV), Ballotpedia.
The problem with ranked-choice voting, by Thomas Buckley, American Thinker, 13 Ferbuary 2023.
The many failures of ranked choice voting, by Emmaline Merrill, American Thinker, 25 July 2024.
Ranked-Choice Voting: A Disaster in Disguise, The Foundation for Government Accountability (FGA). 25 August 2022.
Ranked Choice Voting Is a Bad Choice, Heritage Foundation, 23 August 2023.
Baked Alaskan: 60% of voters cast ballots for Republicans. A Democrat won, by Ed Morrissey, 1 September 2022.
The Limits of Ranked-Choice Voting, Center for Election Science, 7 February 2019.
Republicans Must Stand Up to Ranked-Choice Voting, by Aaron Flanigan, AMAC, 3 November 2023.
Ranked Choice Voting Disaster, 9 April 2024.
Research, resources, and contact information
Here are various reference and research items, and selected contact information for various entities. Check back for updated information.
Contact your legislators
How to contact your Colorado legislators and US Senators and Representatives
National contact information
Department of Homeland Security
Operator Number: 202-282-8000
Comment Line: 202-282-8495
Legal
Immigration Court
Denver, CO 80294
303-844-5815
State contact information
Colorado State Refugee Coordinator: Paul Stein 303-863-8217
Please check back for updated information.
SPLC - Southern Poverty Law Center hate group
Decades ago, the Southern Poverty Law Center (SPLC) made a name for itself fighting genuinely extremist groups like the Ku Klux Klan. Those groups have pretty much disappeared, leaving the SPLC suddenly at a loss for issues on which to fundraise. The solution was to find a hate group under every rock and around every corner. Thousands are still waiting to be uncovered! The job of the SPLC will never be done, and it will take a huge amount of donor support to continue this crusade.
We recommend the excellent book: Making Hate Pay: The Corruption of the Southern Poverty Law Center, by Tyler O'Neil, 2020. Here is a good review of the book: How The Southern Poverty Law Center Started Inventing ‘Hate Groups’, by Kyle Shideler, The Federalist, April 24, 2020.
Here is a compilation of some of the articles, resources, and references exposing the SPLC fundraising machine.
The Reckoning of Morris Dees and the Southern Poverty Law Center, by Bob Moser, The New Yorker, 21 March 2019.
Turmoil Engulfs the SPLCA closer look at the underlying scam of the organization’s ‘hate group designation’, by Paul Nachman, The Social Contract, Spring, 2019.
The Southern Poverty Law Center (SPLC) has been rated "poor" by Charity Navigator, stating that net assets were $152 million. The SPLC 2015 tax form 990 reveals that the SPLC has in fact amassed over $328 million in assets.
Immigration and the SPLC, Jerry Kammer, Center for Immigration Studies, March 2010:
Rather than engage in a debate, La Raza and its allies have waged a campaign to have the other side shunned by the press, civil society, and elected officials. It is an effort to destroy the reputations of its targets. It also seeks to intimidate and coerce others into silence. It undermines basic principles of civil society and democratic discussion...
Crazy SPLC smears black woman as white nationalist, Fred Elbel, CAIRCO, November 5, 2015.
Southern Poverty Law Center: Wellspring of Manufactured Hate, James Simpson, Organization Trends, Capital Research Center, September 25, 2012:
SPLC senior fellow Mark Potok doesn’t mince words about illegal-immigration opponents:
“Sometimes the press will describe us as monitoring hate crimes and so on … I want to say plainly that our aim in life is to destroy these groups, to completely destroy them.…” [Watch video]...
Though trained as a lawyer, [SPLC Founder Morris] Dees is best known for his fundraising ability...
With over $238 million in net assets, the SPLC is one of the wealthiest nonprofit organizations in the United States. Despite this massive endowment, the Center devotes almost 20 percent of its $34.5 million operating expenses – $6.5 million in 2011 – to fundraising. This includes $1 million for fundraising services and $5.5 million in fundraising staff salaries and administrative expenses.
Meanwhile, the group spent only $11 million on its supposed primary mission: “providing legal services to victims of civil rights injustices and hate crimes.”...
Poverty Palace - How the Southern Poverty Law Center got rich fighting the Klan, John Egerton, The Progressive, July 1988. (Also see references on The SPLC and Fundraising Up-Close). Excerpt from 2008 letter:
Dees and [partner Millard Fuller] were in hot pursuit of their first million dollars, and each of them reached that goal in 1964. "Morris and I, from the first day of our partnership, shared the overriding purpose of making a pile of money," Fuller wrote in a book some years later. "We were not particular about how we did it; we just wanted to be independently rich. During the eight years we worked together, we never wavered in that resolve."

Southern Poverty Law Center – Manufacturing Hate for Fun and Profit, James Simpson, Breitbart, February 16, 2016.
Associated Press: SPLC Using Hate Group Label to Target 'Conservative Viewpoints', Breitbart, January 22, 2016.
The SPLC exposed - Southern Poverty Law Center - Morris Dees and hate crimes, The Social Contract.
King of Fearmongers - Morris Dees and the Southern Poverty Law Center, scaring donors since 1971, Charlotte Allen, The Weekley Standard, April 15, 2013:
What has infuriated the SPLC’s liberal critics is their suspicion that Morris Dees has used the SPLC primarily as a fundraising machine fueled by his direct-mail talents that generates a nice living for himself (the SPLC’s 2010 tax filing lists a compensation package of $345,000 for him as the organization’s chief trial counsel and highest-paid employee) and a handful of other high ranking SPLC officials plus luxurious offices and perks, but that does relatively little in the way of providing the legal services to poor people that its name implies.
CharityWatch (formerly the American Institute of Philanthropy), an independent organization that monitors and rates leading nonprofits for their fundraising efficiency, has consistently given the SPLC its lowest grade of “F” (i.e., “poor”) for its stockpiling of assets far beyond what CharityWatch deems a reasonable reserve (three years’ worth of operating expenses) to tide it over during donation-lean years. But even if the SPLC weren’t sitting on an unspent $256 million, according to CharityWatch, it would still be a mediocre (“C+”) performer among nonprofits.
Southern Poverty Law Center's Lucrative 'Hate Group' Label, Rosslyn Smith, American Thinker. August 22, 2012.
Racial Racketeering for Fun and Profit: The Southern Poverty Law Center Scam, Thomas J. DiLorenzo, published on LewRockwell.com, June 22, 2011:
CIS: SPLC Manipulated the media with smear campaign, Center for Immigration Studies.
King of the Hate Business, Alexander Cockburn, Creators, 2009:
The sun is dipping low in the evening sky over the Republican Party as the Other Leading Brand... It's also horrible news for people who raise money and make money selling the notion there's a right resurgence out there in the hinterland with massed legions of haters, ready to march down Main Street draped in Klan robes, a copy of "Mein Kampf" tucked under one arm and a Bible under the other.
What is the arch-salesman of hate mongering, Mr. Morris Dees of the Southern Poverty Law Center, going to do now?...
Dees and his hate-seekers scour the landscape for hate like the arms manufacturers inventing new threats and for the same reason: It's their staple.
The Church of Morris Dees, Ken Silverstein, Originally published by Harpers Magazine, November, 2000:
Lump of Coal, Fairfax Journal, December 16, 2003:
... human nature being what it is, there always seems to be a lump of coal lurking among the sugarplums. We were reminded of this unpleasant fact again by a Journal reader in Arlington who considered making a contribution to the Southern Poverty Law Center, listed as No. 0454 in the Combined Federal Campaign...
In fact, unknown to most CFC donors, the tax-exempt SPLC flunked an audit by the Arlington-based Better Business Bureau's Wise Giving Alliance, which requires that "a reasonable percentage, at least 50 percent of total income from all sources, should be applied to programs and activities directly related to the purposes for which the organization exists."
...SPLC...spent 89 percent of its total income on fund-raising and administrative costs...
Granted, administrative costs tend to run high when executive salaries are in the six-figure range. For example,... Morris Dees, SPLC's chief trial lawyer, pulls down a cool $280,699...
... give your hard-earned dollars to a real charity, not a bunch of slick, parasitic hucksters who live high on the hog by raising money on behalf of needy people who never see a dime of it.
When a hate crime is something to love, Wesley Pruden, Editor in Chief, The Washington Times, February, 2004:
...Morris Dees [founder of the Southern Poverty Law Center] won a judgment for a black woman whose son was killed by Klansmen. She received $51,875 as settlement. Mr. Dees, according to an investigation by the Montgomery Advertiser, pulled in $9 million from fund-raising solicitation letters that featured a particularly gruesome photograph of the grieving mother's son. Mr. Dees, who pays himself an annual salary of $275,000, offered the grieving mother none of the $9 million her son's death made for him.
Mr. Dees, in fact, earns - or is paid, which is not necessarily the same thing - more than nearly any officer of other advocacy groups surveyed by the National Journal, more than the chairmen of the ACLU, the NAACP Legal Defense Fund and the Children's Defense Fund.
"You are a fraud and a con man," Stephen Bright, director of the Southern Center for Human Rights, which actually takes on dozens of death-penalty appeals for poor blacks every year, once told him. "You spend so much, accomplish so little, and promote yourself so shamelessly."...
White guilt can be manipulated with black pain, but it has to be done carefully. It's a sordid scam. Some people would call what Morris Dees does a hate crime, but it's a living, and a very good one.
The Southern Poverty Law Center: A Twisted Definition of Hate, Matthew Vadum, Capital Research Center, November, 2006.
The truth about 'hate crimes' and the racial justice racket, Ron Smith, Baltimore Sun, December 3, 2008.
The Southern Poverty Law Center - No Artistry in its Smears, Don Feder, DiscoverTheNetworks.org, February 8, 2001.
Mission Creep and the Southern Poverty Law Center's Misguided Focus, Carol M. Swain, Political Analyst, Professor of Political Science and Law at Vanderbilt University (original article, August 10, 2009).
Who is the Southern Poverty Law Center and What is Their Role in the Campaign Against Prop. 200?, FAIR, August 24, 2004.
Intolerance Identified - Morris Dees and The Southern Poverty Law Center, Karen De Coster, originally published on ZolaTimes.com, December, 2000, and The Laissez Faire City Times, December, 2000.
Wypijewski Replies on the Southern Poverty Law Center, JoAnn Wypijewski, The Nation, February 8, 2001.
Hate and Slander for Profit - Dissecting the Southern Poverty Law Center Report, Digger's Realm, August, 2009.
Morris Dees Fact Sheet, Originally published by The Patriotist.
Morris Dees background information, Discover the Networks.
Morris Dees Personal Information, references and video compiled by The Social Contract.
Charity Navigator gave the SPLC an overall rating of only one star and a score of only 39 in 2004.
The American Institute of Philanthropy's Charity Watch gave the SPLC an overall rating of F from 1999 through August, 2009.
The SPLC File - An Exclusive Report on the Southern Poverty Law Center, The Social Contract, Spring 2018. The entire issue covers the SPLC. Articles include:

- A Note from the Editor - Watching the 'Watchers' - the SPLC Unmasked, by Wayne Lutton, Ph.D.
- The $outhern Poverty Law Center ...and the latest scourge of blacklisting, career-purging, and political cleansing, by The Social Contract Editors
- A Peek Into Hate, Inc., by Peter B. Gemma
- The Southern Poverty Law Center - Institution of weaponized hate, by James Simpson
- Cooking the Books on 'Hate' - A closer look at SPLC's famous list, by Steven Menzies
- The Church of Morris Dees - How the Southern Poverty Law Center profits from intolerance, by Ken Silverstein
- Why the Government Should Sever Its Ties with the SPLC, by Social Contract Editors
- In the War to Defend Western Civilization from Jihadist Islam, the SPLC Sides with the Enemy, by Brenda Walker
- Law Enforcement Agent Condemns SPLC, by Social Contract Editors
- SPLC: Extreme Left-Wing 'Muckrakers', by The Social Contract Editors
- Teaching Tolerance - The SPLC's youth mission, by Martin Witkerk
- Bill Ayers and the SPLC's Teaching Tolerance Project, by The Social Contract Editors
- SPLC: Radical Evil Posing as Good, by John Vinson
- An Expert on Fringe Political Movements Reflects on the SPLC’s Political Agenda An exclusive interview with author and researcher Laird Wilcox, by Peter B. Gemma
- The Practice of Ritual Defamation - How values, opinions, and beliefs are controlled in democratic societies, by Laird Wilcox
- SPLC: Morris Dees' Award-Winning Cash Machine, by Wayne Lutton
- The SPLC’s Censorship Collaboration with Google, by Fred Elbel
- The Deceptive Methods of the Southern Poverty Law Center, by Dave Gibson
- The SPLC State ...and the unprecedented threat to civil liberties, by James Kirkpatrick
- SPLC’s MO: Audacter calumniare, semper aliquid haeret (Slander boldly, something always sticks), by John H. Tanton
- Rules for Radicals: Handbook for the SPLC and Its Allies, by Wayne Lutton
The Southern Poverty Law Center - A Special Report, The Social Contract, Spring 2010. The entire issue covers the SPLC. Articles include:

- A Note from the Editor - The SPLC: Poisoning Public Discourse
- The Southern Poverty Law Center - An Introduction
- Fighting 'Hate' for Profit and Power: The SPLC's Political Agenda Up Close
- Cooking the Books on 'Hate'- A Closer Look at SPLC's Famous List
- The Church of Morris Dees - How the Southern Poverty Law Center Profits from Intolerance
- SPLC: America's Left-Wing Hate Machine
- Bashing for Dollars The SPLC's Predatory Game
- The Hidden Agenda of the SPLC
- An Expert on Fringe Political Movements Reflects on the SPLC's Political Agenda - An Exclusive Interview with Author and Researcher Laird Wilcox
- The Practice of Ritual Defamation - How Values, Opinions, and Beliefs Are Controlled in Democratic Societies
- The Southern Poverty Law (and Investing) Center - Will SPLC, a Beneficiary of Financial Swindler Bernie Madoff, Return Its Madoff Money?
- Good News: SPLC Loses $50 Million; Bad News: SPLC Can Afford It
- Targeting the Tea Parties
Wacky SPLC furthers repressive Sharia agenda, Fred Elbel, CAIRCO, February 16, 2016.
Frank Gaffney discusses the SPLC on Tipping Point with Liz Wheeler, February 10, 2016 (video removed from youtube).
Video: Pamela Geller: SPLC Hit List, February 22, 2016:
Cultural Marxism and Political Correctness
Here is a collection of articles exposing the SPLC that are archived on CAIRCO.
SPLC targets Colorado Alliance for Immigration Reform for Punishment, Stephen Byron Gassaway, Global Gulag, February 19, 2016.
Southern Poverty Law Center Transfers Millions in Cash to Offshore Entities - Left-wing nonprofit pays lucrative six-figure salaries to top management, by Joe Schoffstall, Washington Free Beacon, August 31, 2017.
Southern Poverty Law Center Now Has $162 Million Stashed in Offshore Accounts - Organization paid disgraced former leaders over $1 million last year, Washington Free Beacon, April 29, 2020.
Hate Profiteering: The SPLC Hate Hustlers, by Mark Alexander, Patriot Post, August 30, 2017.
Charity Watch downgrades SPLC to "F" rating, March, 2019.
Lawsuit Against SPLC Hate Group Moves Forward, by Fred Elbel, CAIRCO, 4 April 2023.
SPLC Targets Gay Group as ‘Hate Group’ for Opposing Transgenderism, Breitbart, 8 June 2024.
Southern Poverty Law Center Fires 25% of Staff - A good start, by Daniel Greenfield, 14 June 2024.
And finally:
Oh no! The hateful SPLC hate group hates us!, Fred Elbel, CAIRCO, February 17, 2016:
Can you believe it? The Denver Pravda Post called the Colorado Alliance for Immigration Reform a hate group! Here's the article: Colorado had 16 hate groups in 2015, says Southern Poverty Law Center.
What a hoot!
Can you imagine? The discredited SPLC moneymaking machine has christened the Colorado Alliance for Immigration Reform a hate group!
CAIRCO.org has been active in Colorado since the mid 1990s. Our primary focus is - and always has been - issues of sustainability, and the environmental and societal consequences of unending immigration-driven population growth.
Franklin D. Roosevelt remarked, "I ask you to judge me by the enemies I have made."
Unfortunately, the SPLC is in a (bottom-dwelling) class of their own. They aren't capable of debating serious issues on their own merits, so they presumptuously resort to name calling in faltering attempts at intimidation.
You know, that's a formal debating tactic. It's called an ad hominem attack - something to be used in last resort when all serious logical arguments fail. As such, we really can't consider the SPLC an enemy of substance. But they tried.
I am embarrassed for Noelle Phillips and the Denver Post for regurgitating this tripe without surmounting the modicum of energy required to initiate even so much as a perfunctory email to CAIRCO to confirm this imputation. Can you smell media laziness? Media bias?
In any case, it's an honor - albeit an indiscernible one - to be included on the hateful SPLC's hate list.
Fred Elbel
Director, Colorado Alliance for Immigration Reform
CAIRCO.org
Update February 22, 2018: The Denver Post contacted CAIRCO and published a statement from CAIRCO on the hateful SPLC hate group. It's nice to see reporting that is a bit more thorough. However, we noticed that the article completely ignored the multitude of articles and journals thoroughly discrediting the SPLC hate group. That omission reveals the implicit bias of the Denver Post.


Slavery: setting the record straight on slavery
Slavery existed in the United States well before America was formed. America's founders created a union under which slavery was abolished. But leftists disparage our Constitution and our country nevertheless based upon the false premise that Whites are all racists.
Slaves were captured in Africa by Africans, and were sold to pre-American slave traders via Muslim slave traders. Approximately 15 million Europeans had been captured and enslaved by Muslims between the fifteenth and nineteenth centuries - far more than European slave-traders took from Africa in the same period.
Learn more about the actual history of slavery - see the following articles and video:
1. Time to Set the Record Straight on Slavery, by James Simpson, American Thinker, September 30, 2019:
According to Harvard professor Henry Louis Gates, 12.5 million African slaves were shipped to the New World between 1525 and 1866, and 10.7 million (about 86 percent) survived the trip. Of these, only 450,000 (about 4 percent of the total) were sent to America. The rest were shipped to South America and the Caribbean. Brazil alone received 4.9 million. Why are there no calls for reparations in Brazil? And the black slave trade to the West pales in comparison to the white and black slave trade conducted by Muslim nations of Africa and the Middle East in its barbarity and numbers.
The much larger and infinitely more barbaric Muslim slave trade began in about 711, capturing both whites and blacks in numbers much higher than those taken by the West, and Muslim slave-traders provided over 80 percent of those black slaves sold to the West. Of the slaves captured by Muslims for their own use, 80 to 90 percent died on the way to market. Of those shipped to North Africa for sale to Western slavers, about 30–50 percent died en route. Males slated for Muslim markets were castrated. Only 25 percent survived the operation. Their descendants in those nations are much smaller in number because most male African slaves were used as eunuchs and worked to death. Estimates of total black enslavement in Muslim nations range from 11 million to 32 million. Given the high mortality rate of capture and transport, the impact on black African tribes must have been genocidal....
Just as the Left demands that America pony up trillions of dollars for the bogus "global warming" agenda, while it ignores the much larger pollution quotient produced by China and Russia, it now demands trillions in "reparations" for slavery from the nation that imported the fewest slaves of any and, along with other Western nations, brought about, for the first time in world history, a complete end to legal slavery throughout the world. It's time to set the record straight and end the Left's constant agitation and provocation that deliberately, and fraudulently, fan the flames of division in our great nation.
2. The Islamic Trade in European Slaves, by Emmet Scott, New English Review, December 2016:
By mainstream estimates around 1 million were taken by the Barbary pirates; around 3 million by the Crimean [Tatars] from Russia/Ukraine; about 1 million by the Tartars [Tatars] and Turks from the Caucasus, and about 10 million (by the most conservative estimate) by the Ottomans themselves from central Europe and the Balkans. This gives a grand total of 15 million – far more than European slave-traders took from Africa in the same period. Yet this is a fact quite hidden from the public and unknown to almost everyone in Western Europe and North America. And the conditions endured by European captives in the Ottoman Empire were infinitely worse than those experienced by Africans in the Americas. The latter generally worked on plantations and were permitted, and even encouraged, to marry and have families. By contrast, the Europeans in the Dar al-Islam suffered a terrible fate. Able-bodied men were generally branded and put to endless back-breaking labour, either as galley-slaves or as miners. They were not permitted to marry and were denied all semblance of family life or female companionship. Young boys were invariably castrated – and raped – whilst women were consigned to the sex-slavery of the harem.
The great humanitarian impulse to end slavery, from the late eighteenth century onwards, came entirely from the Christian West, and by the mid-nineteenth century it was stamped out completely in most Christian lands. That slavery no longer exists (officially at least) in the majority of Muslim territories is due entirely to the efforts of Westerners...
3. Understanding the Islam/West Narrative, by Raymond Ibrahim, American Thinker, November 26, 2019:
Any honest and objective appraisal of Islam’s historic jihad on the Christian world is eye-opening, to say the very least. In the first century of its existence (between 632-732) Islam permanently conquered, Arabized, and Islamized nearly three-quarters of the post-Roman Christian world, thereby permanently severing it. Europe came to be known as “the West” because it was literally the remaining and westernmost appendage of Christendom not to be swallowed up by Islam.
For roughly a millennium thereafter, Arabs, Berbers, Turks, and Tatars -- all of whom called and saw themselves as Muslims -- launched raid after raid, all justified and lauded as jihads, into virtually every corner of Europe. They reached as far as Iceland and provoked the U.S. into its first war as a nation. The devastation was indescribable; some regions in Europe, particularly in Spain and the Balkans, remain inhabitable [sic - uninhabited] due to the incessant raiding; some 15 million Europeans were enslaved during this perennial jihad and, according to contemporary records, treated horrifically....
4. The first slaveholder in British North America was ... black:
Anthony Johnson (b. c. 1600 – d. 1670) was a black Angolan known for achieving freedom and wealth in the early 17th-century Colony of Virginia. He was one of the first African American property owners and had his right to legally own a slave recognized by the Virginia courts. Held as an indentured servant in 1621, he earned his freedom after several years, and was granted land by the colony.
Johnson's slave was ... black.
5. Video: Mark Steyn memorably recounts the abolishment of slavery by Western Civilization in answering a question at a Hillsdale College event (question begins at 54:13).
6. "Multicultural" Education, by Thomas Sowell:
Perhaps the classic case is slavery. The widespread revulsion which this hideous institution inspires today was largely confined to Western civilization a century ago, and a century before that was largely confined to a portion of British society. No one seems interested in the epic story of how this curse that covered the globe and endured for thousands of years was finally gotten rid of. It was gotten rid of by the West-- not only in Western societies but in other societies conquered, controlled, or pressured by the West.
The resistance put up by Africans, Asians, and Arabs was monumental in defense of slavery, and lasted for more than a century. Only the overwhelming military power of the West enabled it to prevail on this issue, and only the moral outrage of Western peoples kept their governments' feet to the fire politically to maintain the pressure against slavery around the world. Of course, this is not the kind of story that appeals to the multiculturalists. If it had been the other way around-- if Asian or African imperialists had stamped out slavery in Europe-- it would still be celebrated, in story and song, on campuses across America.
7. Slavery? We Were a Footnote, by John Hinderaker, PowrLine, Novmber 29, 2019:
Liberals are trying to rewrite American history, teaching our children that the only thing that ever happened here... was slavery...
Slavery has existed since time immemorial on every continent except Antarctica, as Thomas Sowell wrote years ago. An estimated one-third to one-half of the inhabitants of the Roman empire, for example, were slaves. For more than 1,000 years, slaves (few of them Africans) were one of the basic commodities of trade across most of the world...
The Eastern slave trade went to Arab countries. For a long time, the Arabs bought or captured European slaves, but when that supply dried up, they turned to Africa. Numbers are hard to come by–weirdly, the Arab slave trade hasn’t been as widely studied as the Western trade–but this source estimates that 17 million East Africans were sold into slavery in Islamic countries....
To my knowledge, the best data source on the Western, or trans-Atlantic, slave trade is the Trans-Atlantic and Intra-American slave trade database... This chart, from that source, shows how many slaves disembarked at various locations between 1501 and 1875. Click to enlarge:

The database shows a total of 10,702,654 slaves transported in the Atlantic trade. Of those, only 388,747 arrived in mainland North America, what became the United States–3.6% of the total in the trans-Atlantic trade, and well under 2% of the total slaves exported from Africa....

But virtually no one seriously opposed slavery in principle... until the late 18th and early 19th centuries, when Christians in England and America, with a powerful assist from Jews, argued for the first time that slavery was wrong per se. Thereafter, the British Navy played the lead role in suppressing the slave trade....
Here in the U.S., the Republican Party was founded principally to combat slavery, which the Democratic Party fought bitterly to preserve. After the loss of 600,000 lives–far more than the number of African slaves who were brought to the colonies... abolition was achieved....
8. Animated chart of the day: African slaves brought to the New World by region, 1511-1870, by Mark J. Perry, Carpe Diem, December 1, 2019:
Here are some observations on the animated visualization above (these obsrvations have been deleted from the original source):
1. Of the nearly 10 million African slaves brought to the New World between 1511 and 1870, more than one-half (5.1 million and 52.8% of the total) disembarked in Brazil... Of the remaining approximately 1 million African slaves who were brought to the New World, 658,000 (and 6.8% of the total) disembarked in the Spanish Americas (Mexico, Central America, Colombia, Venezuela, etc.) and only about 366,000 arrived in mainland North America (which became the United States) representing only 3.8% of the total slaves in the trans-Atlantic trade. For every one African slave brought to the United States, there were more than 26 slaves who arrived elsewhere in the New World (Brazil, Caribbean, and Spanish Americas).
2. By ratios, there were nearly 14 times as many slaves brought to the Caribbean and nearly 10 times as many slaves brought to Brazil as the United States (Mainland North America)....
4. In 1700 when there were only 12,000 slaves in the United States, there were more than half a million in the Caribbean (517,000) and the Spanish Americas (553,000). By the early 1800s when the number of slaves brought to the United States peaked and stabilized at about 361,000, there were more than 4 million slaves in the Carribbean and nearly 2 million in Brazil. Between 1810 and before the Civil War started in 1861, fewer than 5,000 African slaves arrived in the United States.
5. Even as the slave trade stopped in the United States, the Spanish Americas, and Brazil by around 1860, more than 135,000 African slaves were brought to the Caribbean between 1856 and 1870...
9. American Slavery in the Global Context, by Dan McLaughlin, National Review, 6 January 2022. A long but excellent article detailing the history of slavery worldwide.
10. America’s Buried History of White Slavery, by Larry Romanoff, American Greatness, 18 February 2023: In fact, an examination of available documentation indicates that white slavery in the Americas was a much more extensive operation than was black slavery, and the numbers may be severely under-estimated... One eyewitness to the mass kidnapping of poor Whites estimated that from his personal knowledge alone, at least 10,000 were sold into slavery every year from throughout Great Britain for perhaps two centuries.
11. The mob comes for Madison - On the woke hijacking of James Madison’s Montpelier, The New Criterion, editor Roger Kimball, January 2023. Most of the miasma in the U.S. - and indeed across Western societies more generally - ultimately originates in the (unfounded) guilt trip over slavery. In this article, Roger Kimball writes masterfully about this fundamental point:
If chattel slavery hadn't existed in the United States, the Left would have had to invent it. What we mean is that the idea of slavery has become so dear to the disciples of identity politics that without its moral sanction they would be lost. Absent the original sin of slavery, the entire racialist racket that holds our society hostage would sputter to an inglorious halt. The race hustlers promoting "affirmative action" (i.e., race- or sex-based discrimination) would be out of business, as would the real-estate magnates and firebugs of Black Lives Matter. Ditto the angry historical fantasists behind The 1619 Project. Forget that most societies practiced slavery throughout history. Is anyone asking for "reparations" because their ancestors may have been enslaved by the Egyptians, the Persians, the Greeks, or the Romans? Forget that slavery ended in the United States more than one hundred and fifty years ago because Abraham Lincoln prosecuted a brutal civil war to keep the country together and end the "peculiar institution," which was not peculiar at all. (When, by the way, will slavery end in Islamic society, or India, or China?) The world has had numerous long-distance trades in slaves of different phenotypes. Most of the West African slaves who made their way to America were sold into servitude by black African slavers.
Those impolitic facts are what the Bolsheviks of old called “counterrevolutionary.” That is, they are politically "false" even if empirically true. The wardens of wokeness tell us that they hate slavery and its legacy. Doubtless in one sense they do. But they are divided in their minds. They also cherish the historical fact of slavery. For one thing, they understand that it is their irrevocable meal ticket. They also perceive that it is an imperishable source of emotional power. Because it is a wound that can never heal, it is also a sin that white society can never expiate—which is why they tell the world that the legacy of slavery is ubiquitous and ineradicable. But if that were true, why should anyone have ever bothered to campaign against it? It would be like campaigning against the onset of night.
We understand that to ask such questions is to be guilty of "racism," the cardinal tort of our age whose almost aphrodisiac power is ultimately guaranteed by the inexhaustible well of victimhood that slavery, or the exploitation of the idea of slavery, has dug. Martin Luther King Jr. famously dreamed that people would be judged by the content of their character, not the color of their skin. That is now regarded as a reactionary, indeed a racist sentiment. After all, to judge people by their character, by what they actually do, would upset the entire racialist concession. From now on, race is everything, character a dispensable epiphenomenon. And the ultimate power source, the inexhaustible kernel of animus that fuels the racialist requisition, is the historical accident of chattel slavery in the United States...
Countries That Still Have Slavery 2021
From Countries That Still Have Slavery 2021, World Population Review:
Today, 167 countries still have some form of modern slavery, which affects an estimated 46 million people worldwide....
Top 10 Countries with the Highest Prevalence of Modern Slavery (by total number of slaves) - Global Slavery Index 2018:
India - 7,989,000
China - 3,864,000
North Korea - 2,640,000
Nigeria - 1,386,000
Iran - 1,289,000
Indonesia - 1,220,000
Congo (Democratic Republic of) - 1,045,000
Russia - 794,000
Philippines - 784,000
Afghanistan - 749,000
... Top 10 Countries with the Highest Prevalence of Modern Slavery (by slaves per 1000 residents) - Global Slavery Index 2018:
North Korea - 104.6 (10.46%)
Eritrea - 93 (9.3%)
Burundi - 40 (4.0%)
Central African Republic - 22.3 (2.23%)
Afghanistan - 22.2 (2.22%)
Mauritania - 21.4 (2.14%)
South Sudan - 20.5 (2.05%)
Pakistan - 16.8 (1.68%)
Cambodia - 16.8 (1.68%)
Iran - 16.2 (1.62%)
... Slavery was abolished throughout the U.S. following the Civil War in 1965. The 13th Amendment to the U.S. Constitution states, "Neither slavery nor involuntary servitude, except as a punishment for crime whereof the party shall have been duly convicted, shall exist within the United States, or any place subject to their jurisdiction."...
This was discussed on the Mark Levin show on 5 January, 2022. Listen to podcast.
Books on the slave trade
Christian Slaves, Muslim Masters: White Slavery in the Mediterranean, The Barbary Coast, and Italy, 1500-1800 (Early Modern History: Society and Culture), by R. Davis (2003).
Sword and Scimitar: Fourteen Centuries of War between Islam and the West, by Raymond Ibrahim (2018).
The Trans-Saharan Slave Trade (History and Society in the Islamic World), by John Wright (2007). From the book's description:
This compelling text sheds light on the important but under studied trans-Saharan slave trade. The author uncovers and surveys this, the least-noticed of the slave trades out of Africa, which from the seventh to the twentieth centuries quielty delievered almost as many black Africans into foreign servitude as did the far busier, but much briefer Atlantic and East African trades.
Illuminating for the first time a significant, but ignored subject, the book supports and widens current scholarly examination of Africans' essential role in the enslavement of fellow-Africans and their delivery to internal, Atlantic or trans-Saharan markets.
The East African Slave Trade: The History and Legacy of the Arab Slave Trade and the Indian Ocean Slave Trade, by Charles River Editors (2017).
White Gold, by Giles Milton (2005).
Breaking the Chains: The Royal Navy’s War on White Slavery, by Tom Pocock (2013).
White Slavery in the Barbary States, by Charles Sumner (2017).
Captives and Companions: A History of Slavery and the Slave Trade in the Islamic World, by Justin Marozzi (2025).
Related
1,300 Years of Forgotten Black Genocide of the Arab Islamic Slave Trade, by Amil Imani, Geller Report, 17 November 2025.
Race and immigration - the final taboo.
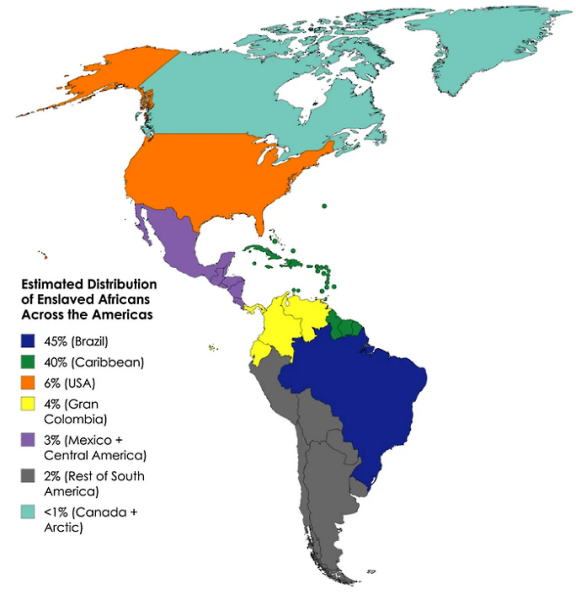
Statue of Liberty - Liberty Enlightening the World
The Statue of Liberty was erected in 1886, when world population was little more than one billion and United States population was 60 million. Many do not realize that the Statue of Liberty was a gift to the United States from France, with the title, "Liberty Enlightening the World". The statue and its symbolism had nothing to do with immigration, but rather hope that the rest of the world would adopt Democracy. The Emma Lazurus plaque (it is not chiseled in the base), "send me your huddled masses" was added ten years later during the immigration peak of that age.
The sonnet, "New Colossus", was written by Emma Lazarus in 1883 as part of a literary campaign to raise funds for the completion of the Statue's pedestal. Not much attention was paid to it until the tide of immigration surged at the turn of the century. Proceeds that were raised from its auction were used to complete the pedestal of the Statue of Liberty. This plaque memorialized the sonnet in 1903 and was placed on the inner wall of the Statue's pedestal. It currently is displayed inside the Statue of Liberty museum.
Since then, U.S. population has expanded by a factor of five.
Roberto Suroclarified the misinterpretation of the Lazarus poem in his July 5, 2009 Washington Post article, The Statue of Liberty's Real Stand:
... Let's get rid of The Poem.
I'm talking about "Give me your tired, your poor..." -- that poem, "The New Colossus" by Emma Lazarus, which sometimes seems to define us as a nation even more than Lady Liberty herself.
Inscribed on a small brass plaque mounted inside the statue's stone base, the poem is an appendix, added belatedly, and it can safely be removed, shrouded or at least marked with a big asterisk. We live in a different era of immigration, and the schmaltzy sonnet offers a dangerously distorted picture of the relationship between newcomers and their new land.
The most enduring meaning conveyed by Lady Liberty has nothing do with immigration, and I say let's go back to that. The statue's original name is "Liberty Enlightening the World," and the tablet the lady holds in her left hand reads "July IV, MDCCLXXVI" to commemorate the signing of the Declaration of Independence. Lady Liberty celebrates U.S. political values as a force for the betterment of humanity, as well as the bond of friendship among freedom-loving nations. That's a powerful and worthy message...
Born into a wealthy family that traced its roots to New York City's earliest Jewish residents, Lazarus was a social activist as well as an accomplished writer. She lent a hand at the station on Wards Island where destitute immigrants were detained, and she helped set up a training school in the tenements. When Lazarus wrote the poem in 1883, she was a prominent advocate for Jews fleeing the pogroms of imperial Russia.
It took a long time for Lady Liberty and the huddled masses to become completely intertwined. Most of the early mythologizing of the statue played on its patriotic appeal. The poem, written for a charity auction that raised money for the statue's pedestal, was never commercially published and got no mention at the statue's grand opening in 1886. Lazarus died a year later at age 38. In 1903, her friend from New York high society, Georgina Schuyler, had the plaque made to honor Lazarus. There was no ceremony when it was placed on a stairway landing inside the pedestal. For decades it went largely unnoticed, a memorial to a writer and reformer who died young rather than a defining inscription for the statue...
Look back with caution is my advice. Bad poetry makes for bad policy...
Also see this article: A Symbol Transformed - The Statue of Liberty, by Elizabeth Koed, The Social Contract, Summer 2005:
When French sculptor Frederic-Auguste Bartholdi assembled his 152-foot statue atop a pedestal on small Bedloe's Island in 1886, however, the symbol we so readily acknowledge today did not exist. Rather, this gift from the French nation celebrated the successful American experiment in republicanism. It was a gesture of friendship and alliance. It commemorated the ties that bound the two nations together as they strove to achieve their goals of liberty and equality. But over Liberty's first century, this original intent has been transformed into quite a different symbol. Although attributed to the familiar sonnet by Emma Lazarus, the "Mother of Exiles" symbol has been largely the product of, first, coincidence, and then of many decades of gradual incorporation as the statue became a familiar image that could be used for many purposes. The symbol has strayed far from the original idea. As historian David McCullough explained, "The idea, of course, is liberty, and liberty is what we Americans have always wanted first of all. It was what the Revolution was fought for, what the country was founded for. 'Hail, Liberty!' was the cry on the day the statue was unveiled." Unfortunately, by the time Liberty turned 100 those lofty ideals were all but lost, replaced in the ceremonial pomp by glitzy tributes to America's immigrant population and the "golden doors."
Related
SteynPost #19: Liberty and Immigration, Mark Steyn, August 8, 2017:
Mark Steyn discusses how the Statue of liberty is not about importing immigrants, but rather exporting liberty to the world. Americans tacked a third-rate poem to the base and turned it into an icon of mass immigration.
Steyn's conclusion at 24:00 is particularly worth watching:
Emma Lazarus' Poem Was Little Known Until WWII, by Steve Sailer, Unz Review, August 16, 2019:
...Uh, wasn’t it Lazarus’s friend from Richmond, VA, Constance Cary Harrison, the Betsy Ross of the Confederate Battle Flag, who persuaded Lazarus to write it? Lazarus’s family had had a lot of business ties to the Confederacy....
From Slate:The Complicated History of Emma Lazarus’ “The New Colossus”:
So she writes this poem, and this is where she audaciously brings the demand to the American people on behalf of all the “tired and poor … the huddled masses yearning to breathe free.” …
1882 was also the year of the Immigration Act of 1882, and the Chinese Exclusion Act. I’ve been through Emma Lazarus’ letters many times, and I don’t see her commenting about either piece of legislation. I’ve looked. …
So, basically, Emma Lazarus was concerned about the anti-Semitic pogroms that began in Russia in 1881, and not interested in other people’s problems. Seems like sensible ethnocentrism to me....
Google’s Ngram of usage of “wretched refuse” in books shows it took off in 1939-1943, and then stayed at the same level through 2007 (the last usable date in the Ngram archive)....
So the fame of “The New Colossus” was a World War II thing: This huge 1939-1943 spike probably had to do with concern for refugees from Naziism. E.g., the 1942 movie Casablanca is about refugees.
Okay, that finally makes sense: the poem’s fame traces to the Casablanca era, a time of highly quotable, mass market, vaguely leftist schmaltz.
Basically, the poem was written in response to the Russian anti-Semitic pogroms of 1881 and finally became famous following German anti-Semitic Kristallnacht pogrom of late 1938.
So, that means the poem isn’t really about immigrants, it’s about refugees. It was written about Jewish refugees from anti-Semitic violence and it became permanently famous during another era of anti-Semitic violence generating refugees....
The Statue of Liberty stands firm on liberty, not a poem, enlightening the world, CAIRCO.
Time to Remove Socialist “Huddled Masses” Plaque from Statue of Liberty, by Selwyn Duke, Canada Free Press, February 2, 2018.
Statue of Liberty Declares: STOP IMMIGRATION!, by Tim Murray, April 2, 2019.
Terminology
Definitions of important terms are included below. For additional information, also see the section Islamic terminology you should know.
The ad hominem attack is a formal debating tactic of attacking your opponent's character as opposed to answering their argument. It is a de facto admission of the inability to win the debate on the merits of one's argument alone. Example: calling an immigration reductionist racist, nativist, or xenophobe. The ad hominem attack is a tool of cultural Marxism.
An alien is defined by the U.S. Citizenship and Naturalization Services as "any person not a citizen or national of the United States". The term is defined by United States statute, in Section 1101(a)(3) of the Immigration and Nationality Act of 1952 (with amendments by Congress through 2001). Aliens can be either legally or illegally present in the U.S.
The term "alien" is purposefully and appropriately used in US Government documents, such as in:
"AR-11, Alien's Change of Address Card", and
"Immigration and Nationality Act(INA) - An Act of Congress that, along with other immigration laws, treaties, and conventions of the United States, relates to the immigration, temporary admission, naturalization and removal of aliens".
For more information, see:
- Terminology history and usage: alien and illegal alien - extensive research.
- U.S. Citizenship and Naturalization Services, Glossary of Terms, as of April 3, 2013.
- What is an alien?, Juan Mann's Frequently Asked Questions About Immigration and the Law, VDare.com, December 11, 2002.
- Definitions of illegal alien and undocumented immigrant.
Under anarcho-tyranny, government neglects to enforce laws and perform functions it has a legitimate duty to enforce and perform, while inventing laws it has no legitimate duty to make or enforce.
"Criminals aren't punished (which is why it is anarchy), but the innocent are (which is why it's tyranny)." - Samual Francis. See Anarcho-Tyranny, U.S.A. by Samuel Francis, Chronicles, July 1994.
An anchor baby is a child born to illegal alien parents within the borders of the United States. The child is born as an American citizen and under the 1965 immigration Act, can be used to facilitate citizenship for the immediate - and ultimately the extended - family.
The 14th Amendment was ratified in 1868 to protect the rights of native-born black Americans, whose rights were being denied as recently-freed slaves. The amendment states that "All persons born or naturalized in the United States, and subject to the jurisdiction thereof, are citizens of the United States..." In 1866, Senator Jacob Howard clearly spelled out the intent of the 14th Amendment by writing: "Every person born within the limits of the United States, and subject to their jurisdiction, is by virtue of natural law and national law a citizen of the United States. This will not, of course, include persons born in the United States who are foreigners, aliens, who belong to the families of ambassadors or foreign ministers accredited to the Government of the United States, but will include every other class of persons."
The original intent of the 14th Amendment was clearly not to facilitate illegal aliens to defy U.S. law at taxpayer expense.
For more information, see the 14th Amendment and Anchor Babies website.
One who dislikes and discriminates against individual immigrants.
Open borders proponents often label those who favor reducing immigration numbers as "anti-immigrant". Their intent is to discredit immigration reductionists by making false associations with racism, nativism, and xenophobia. The correct term is immigration reductionist. The truth is that nearly all immigration reductionists favor immigrants and immigration, but at a drastically reduced level.
Supporting replacement-level immigration does not mean that one hates immigrants, any more than supporting replacement-level levels of births means that one hates babies.
Balkanization is the separation of a country or region into smaller units, often hostile to each other, sometimes involving the forcible expulsion of entire populations from their homelands by stronger powers. High levels of immigration without assimilation may lead to balkanization.
A big lie is a preposterously false statement that when repeated often enough is regarded as true. The big lie was coined as a propaganda technique by Adolf Hitler. Joseph Goebbels stated that "If you tell a lie big enough and keep repeating it, people will eventually come to believe it. The lie can be maintained only for such time as the State can shield the people from the political, economic and/or military consequences of the lie. It thus becomes vitally important for the State to use all of its powers to repress dissent, for the truth is the mortal enemy of the lie, and thus by extension, the truth is the greatest enemy of the State." Related book: The Big Lie: Exposing the Nazi Roots of the American Left, by Dinesh D'Sousa.
The maximum population of a given species that can be supported indefinitely in a defined habitat without permanently impairing the productivity and functioning of that habitat.
Humanity has been able temporarily to avoid carrying capacity issues through the use technology, preemption of supporting ecosystems normally used to sustain other species, and by transporting and importing resources. Thus, a more appropriate definition of carrying capacity with regard to humanity is the maximum "load" that can safely be imposed on an environment by humanity without permanently impairing the productivity and functioning of that environment. Shrinking carrying capacity may soon become the single most important issue facing humanity.
A Color Revolution is a now-standard technique for promoting regime change in a targeted nation. It is an approach focused on creating a destabilizing revolution in a nation as a means of serving US, European, and/or globalist political interests.
A Color Revolution is typically orchestrated by a public-private partnership comprised of government agencies such as the State Department and MI6 and/or CIA, combined with Non-Governmental Organizations (NGOs).
Russian analysts have used this term since the "Rose Revolution" in Georgia in 2012, in discussing the "Orange Revolution" in Ukraine in 2004, and the "Tulip Revolution" that took place in Kyrgyzstan in 2005.
America is not immune from being the target of a color revolution.
For more information, see Color Revolution.
Comprehensive Immigration Reform is code for amnesty for illegal aliens. The code phrase is used by open borders radicals, liberal Democrats, and establishment politicians.
One who wants to preserve our sustaining natural resources for the benefit of future generations and for the living organisms who exist in our natural environment. By definition, conservationism is conservative, but not all conservatives are conservationists.
The belief that natural resources are essentially of limitless supply and that technology will find solutions to environmental, overpopulation, energy, and resource depletion problems. Cornucopianists hold a subservient, anthropocentric view of the environment and reject the realities of finite resources and the limitations of carrying capacity.
The Deep State (the administrative state) is the permanent bureaucracy consisting of approximately 4,000 political appointees ostensibly ruling 432 agencies and approximately 2.9 million employees (not including the military and postal service). These agencies and permanent employees operate outside the control of Congress, the President, and the judiciary. See The Astonishing Implications of Schedule F.
Diversity is defined as noticeable heterogeneity, and often is used in a social context to mean noticeable presence of multiple races and cultures, without significant assimilation. Diversity is frequently promoted as the desirable condition for American society by those who favor open borders and unlimited immigration.
One who promotes cultural and racial diversity at the expense of an indigenous culture and society, without regard for ecological and social consequences.
The effective land area and corresponding resources required by an individual, city, or nation in order to supply resources and dispose of wastes. It is a measurement of capital stocks, physical flows, and corresponding ecosystem areas required to support a given human population and economy.
For more information, see EcoFuture environmental information.
Mass immigration used since 1990 as a mechanism to grow the economy after allowing investors to move high-wage manufacturing sectors to low-wage countries.
Extraction Migration extracts vast numbers of people from developing countries. The additional consumers, workers, and renters inflate stock values by shrinking Americans' wages, boosting rents, and spiking real estate prices.
Fascism grew out of Marxism. Fascisms founder, Benito Mussolini, was a Marxist and lifelong socialist. Fascism in the United States is expressed in the milder form of progressivism - as a softer form of totalitarianism more in alignment with American culture. See Fascism - a phenomenon of the left. "Fascism should more properly be called corporatism, since it is the merger of state and corporate power." - Mussolini
Fertility is the actual reproductive performance of an individual, a couple, a group, or a population. It is typically used in reference to the average number of live births per woman. Native-born Americans voluntarily achieved replacement-level fertility (2.1 children per woman) in 1972. See EcoFuture Population Terms and Definitions and The Fertility Conundrum.
The "Great Replacement" is the systematic dispossession of White Americans and Europeans by Third World immigrants. See The Great Replacement In Action.
A hate group is an organization that practices hatred or hostility against another group, based on unsubstantiated premises. A hate group may also be an organization that practices unfounded hatred or hostility against other groups or individuals in order to enforce political correctness or to bolster their bottom line. For example, the SPLC - Southern Poverty Law Center hate group.
An artificial ethnicity contrived in 1976, originally meaning "Americans of Spanish origin or descent", but subsequently changed to mean "A person of Mexican, Puerto Rican, Cuban, Central or South American, or other Spanish culture or origin, regardless of race".
In the 1930s, "Hispanics," led by LULAC, opposed identifying Mexicans as "non-white." After affirmative action programs were implemented for Blacks in the 1970s, "Hispanics," dominated by LULAC and La Raza (The Race), changed their racial identity from "white" to "non-white" in order to be eligible for affirmative action programs.
The "Hispanic" category was created on June 16, 1976 by Public Law 94-311, "Economic and Social Statistics for Americans of Spanish Origin." The law contained two significant components: 1) the subject: "Americans of Spanish origin or descent" and 2) the legal status: "American citizens." Both of these qualifiers were soon dropped in an effort to magnify political influence by maximizing numeric size.
In 1977, the Office of Management and Budget (OMB) adopted the title of "Hispanic". Subsequently, "Hispanic" has come to be de defined as "A person of Mexican, Puerto Rican, Cuban, Central or South American, or other Spanish culture or origin, regardless of race."
According to Mark Lopez of the Pew Hispanic Center:
[A]bout two-thirds of Hispanic-Americans identify themselves not as belonging to the general Latino culture, but to their specific country of origin or their parents' homeland.
"The notion of a pan-ethnic identity is actually an American concept," said Lopez, an American citizen whose grandparents emigrated from Mexico. "If I go to El Salvador and I say I'm Hispanic, they're going to think I'm from Spain, or they're not going to know what that means. They don't see a pan-ethnic identity. They see themselves as Salvadoran."
See:
Funding Hate - Foundations and the Radical Hispanic Lobby, Part I, The Social Contract, Fall, 2000.
Hispanics Extend Reach Beyond Enclaves, Wall Street Journal, March 19, 2003.
The Origin of the Term Hispanic, Hartford Guardian, July 27, 2009.
Illegal Alien Propaganda: A Critical Lesson in Terminology and Tactics, Accuracy in Media, April 12, 2013.
Human Biodiversity (HBD) is the diversity found among and between human populations that has a biological basis.
Resources on HBD include:
HBD Fundamentals by JayMan.
HBD Bibliography.
HBD chick - blog focusing on research and analysis.
West Hunter - blog related to HBD by Gregory Cochran and Henry Harpending, authors of The Ten Thousand Year Explosion which discusses human evolution.
DNA Explained - blog on genetic genealogy.
HBD resources, CAIRCO.
An illegal alien is "a foreigner who has entered or resides in a country unlawfully or without the country's authorization." An illegal alien is an alien - that is, a foreign national - who has illegally entered the United States, or who enters legally and then deliberately overstays their visa. An illegal alien is a criminal subject to as much as six months in jail for first offense and subject to federal felony charges for subsequent entries after initial deportation.
Colorado defines an illegal alien as "anyone who has entered the United States illegally and is deportable, or anyone who has 'overstayed a visa' or otherwise violated the terms of his or her legal admission into the United States. Sometimes known as an 'illegal immigrant.'" (From Implementation of Senate Bill 06-090 Performance Audit, Colorado State Auditor, Department of Public Safety, Department of Local Affairs, May 2009.)
The term "illegal alien" is purposefully and appropriately used in US Government documents, such as:
"Immigration Investigations, Enforcement, Detention and Removal: For information about immigration investigations, enforcement, detention or removal of aliens from the U.S., or to report suspected illegal aliens or other illegal immigration activity, please visit the United States Immigration and Customs Enforcement website at www.ice.gov." and
"An illegal alien who entered the United States without inspection, for example, would be strictly defined as an immigrant under the INA but is not a permanent resident alien." and
"Certain illegal aliens who were eligible to apply for temporary resident status under the legalization provision of the Immigration Reform and Control Act of 1986."
For more information, see:
- Terminology history and usage: alien and illegal alien - extensive research.
- Dictionary - illegal alien.
- Implementation of Senate Bill 06-090 Performance Audit, Colorado State Auditor, Department of Public Safety, Department of Local Affairs, May 2009.
- USCIS Service and Office Locator, U.S. Citizenship and Naturalization Services, as of April 3, 2013.
- Permanent Resident Alien, U.S. Citizenship and Naturalization Services, as of April 3, 2013.
- Legalized Aliens, U.S. Citizenship and Naturalization Services, as of April 3, 2013.
- Immigration and the Law.
- 'Illegal Alien:' Tell it like it is
- Illegal Alien - The Proper Terminology
- Doubling Down on Doublespeak
- Associated Press adopts Orwellian doublespeak - drops 'illegal immigrant'.
- Illegal Alien Propaganda: A Critical Lesson in Terminology and Tactics.
- U.S. Appeals Court consistently uses the correct terminology 'illegal alien'.
- It's Official: A Federal Appeals Court Coined The Term 'Illegal Alien' In 1950.
- Illegal alien, illegal alien, illegal alien - save this for when the illegal alien lobby tells you there is no such legal term as 'illegal alien'.
- Definitions of alien and undocumented immigrant.
An immigrant is "a person who comes to a country to take up permanent residence". An immigrant is an invited guest - a person who comes to a country where they are not a citizen in order to settle there. The term "immigrant" implies permanent, legal, residency. (Although because of amnesties and status adjustments, about 25% of currently legal immigrants first came to the U.S. illegally).
The term immigration reform originated in the mid 1990s to mean true reform of incongruous United States immigration policy which blatantly ignored laws regarding interior immigration enforcement and US border security. Over time, open borders radical groups sought to preempt the term "Immigration Reform" to codify their agenda to open American Borders to illegal aliens and to legalize foreign job-seekers who were successful in sneaking into America and avoiding capture at our border. To be clear, one might refer to patriotic immigration reform, as opposed to the open borders kind, which amounts to treason.
An immigration reductionist is one who favors a return to sustainable immigration numbers. Often those favoring immigration reduction are called racist or anti-immigrant, but the truth is that nearly all immigration reductionists favor immigrants and immigration, but at a drastically reduced level.
Immigrants rights advocates promote the rights of legal immigrants - this is a productive and valuable effort. Often open borders advocates and organizations are referred to as "immigrant rights" advocates and organizations. This is a misnomer, designed to be deliberately misleading. Supporting illegal immigration and open borders under this umbrella is by no means supporting immigrant rights; it is supporting the nonexistent rights of illegal aliens to enter our country. The most salient right of illegal aliens who escaped apprehension at our border is to be treated humanely as they are returned to their home countries to reunite with their families.
The belief that immigration is always good, always necessary, must never be questioned in principle, and must be the one constant in an otherwise ever-changing universe of political policy. The belief that a large surplus of immigrants over emigrants is a normal and healthy situation for a nation.
The concern about the well-being of future generations. This concern is often discounted in light of short-term issues. See the article Intergenerational Justice.
Government run by unprincipled career / deep state politicians, corporations, and thieves that has little regard for the rights of American citizens. Government under the control the worst or least-qualified citizens.
Rule by thieves which arises when a country's elite begin to systematically steal from public funds on a vast scale. Kleptocrats nationalize risk while privatizing profits.
Rule by judges. Under the United States Constitution, the judiciary does not have the power to enact laws. Only Congress can enact legislation.
Emphasis on proximal but distinct cultures within a given region or country.
American is not a "nation of immigrants." America is a nation of citizens. America's vast territories were populated by settlers. Settling in an undeveloped land and building a civilization is not comparable to moving to a post-industrial nation and signing up for welfare.
Nativism is the policy of favoring native inhabitants over immigrants. Establishing a goal of stabilizing U.S. population requires addressing both fertility and immigration numbers; however this is not a nativist agenda. Calling an immigration reductionist a nativist is an ad hominem attack.
Government by the few where a small group of elite individuals, families, or corporations control a country.
One who supports the anti-American agenda of illegal immigration and open borders, notwithstanding the express intent of the laws of the land. Typically this is coincident with an anti-nationalist perspective.
Exceeding the carrying capacity of a habitat, which usually leads to a population crash and dieoff. See:
- Video: Arithmetic, Population and Energy - a talk by Al Bartlett.
- Carrying Capacity and Overshoot: Another Look, by Paul Chefurka.
- Book: Overshoot: The Ecological Basis of Revolutionary Change, by William R. Catton. Recommended reading.
- Book: Collision Course: Endless Growth on a Finite Planet.
Political correctness is a belief that language and practices that could offend a minority group should be actively suppressed and censored. Taken to extremes, political correctness becomes a filter that prevents a society from understanding the true nature of issues and events. For example, immigration-driven population growth is often not discussed because of the fear of racist allegations or of being called a hate group.
Political correctness is a form of cultural Marxism. Political correctness was coined in the late 1920s by the Soviets. "Political correctness is communist propaganda writ small." "Political correctness is a weapon used to silence people who tell the truth." - Ayaan Hirsi Ali.
Population momentum is the tendency for population growth to continue beyond the time that replacement-level fertility has been achieved because of the relatively high concentration of people in the childbearing years. It takes a period of time equal to the average life expectancy (approximately three generations or 73 years in the U.S.) for a reduction in fertility to be manifested as a change in actual population numbers. See additional information on fertility and population momentum. Also see this short discussion of population momentum, and Population Terms and Definitions. Also see: Population momentum: If the number of children is not growing, why is the population still increasing?
Racism is the prejudice that members of one race are intrinsically superior to members of other races, and/or prejudice against those of another race. Some racists indeed might want to eliminate immigration of certain races. However, immigration reductionists are not inherently racist, and the goal of stabilizing U.S. population is not predicated upon a racist agenda. Calling an immigration reductionist a racist is an ad hominem attack. See Race and immigration - the final taboo and Setting the record straight on slavery. Also see Critical Race Theory.
Ludwig von Rochau coined the term "realpolitik" in the 19th century. It means using political approaches that are based on practical considerations rather than ideological objectives.
Preserving natural ecosystems and keeping resources intact for future generations - of humans and all species.
The terms "undocumented worker", "unauthorized worker", "undocumented immigrant", "unlawful immigrant", "undocumented alien", "undocumented student", "undocumented migrant", "unauthorized immigrant", and "illegal immigrant" are often used to describe those who have broken the law of our land to enter and work in our country illegally. These are all misleading terms, deliberately used to "soften" the issue of illegal entry into the United States.
The term "undocumented" implies that foreign nationals have the unconditional right to violate America's borders and immigration laws, and that the worst offense they may have committed was forgetting to complete some paperwork. The reality of the situation is the illegal aliens have all kinds of Social Security cards and other documents - it's just that those documents are forged or stolen.
An "immigrant" is an invited guest - a person who comes to a country where they are not a citizen in order to settle there. The term "immigrant" implies permanent, legal, residency. (Although because of amnesties and status adjustments, about 25% of currently legal immigrants first came here illegally).
The accurate description of a foreign national illegally residing in America is "illegal alien". An illegal alien is a criminal subject to as much as six months in jail for first offense and subject to federal felony charges for subsequent entries after deportation.
For more information, see definitions of alien and illegal alien.
Xenophobia is an irrational fear of foreigners or strangers. Americans have every right to establish a population and immigration policy for their own country, based upon the goal of population stabilization and a rational fear of unending population growth. This has nothing to do with fear of other people. Calling an immigration reductionist a xenophobe is an ad hominem attack.
Zero population growth means that a population is in equilibrium, with a growth rate of zero, and is achieved when births plus immigration equal deaths plus emigration. See EcoFuture Population Terms and Definitions.
For additional information, also see the section Islamic terminology you should know.
Terminology history and usage: alien and illegal alien
Definitions
Immigrant
An immigrant is defined by the Merriam-Webster dictionary as "a person who comes to a country to take up permanent residence".
An immigrant is defined in 8 U.S.C. § 1101 : US Code - Section 1101 as:
(15) The term "immigrant" means every alien except an alien who is within one of the following classes of nonimmigrant aliens... (F)(i) an alien having a residence in a foreign country which he has no intention of abandoning, who is a bona fide student qualified to pursue a full course of study and who seeks to enter the United States temporarily and solely for the purpose of pursuing such a course of study... as "any person not a citizen or national of the United States". The term is defined by United States statute, in Section 1101(a)(3) of the Immigration and Nationality Act of 1952 (with amendments by Congress through 2001). Aliens can be either legally or illegally present in the U.S.
Thus, an immigrant is an invited guest - a person who comes to a country where they are not a citizen in order to settle there. The term "immigrant" implies permanent, legal, residency. (Although because of amnesties and status adjustments, about 25% of currently legal immigrants first came to the U.S. illegally).
Alien
An alien is defined in 8 U.S.C. § 1101 : US Code - Section 1101 as "any person not a citizen or national of the United States. 8 U.S. Code § 1325 - Improper entry by alien states:
(a) Improper time or place; avoidance of examination or inspection; misrepresentation and concealment of facts
Any alien who (1) enters or attempts to enter the United States at any time or place other than as designated by immigration officers, or (2) eludes examination or inspection by immigration officers, or (3) attempts to enter or obtains entry to the United States by a willfully false or misleading representation or the willful concealment of a material fact, shall, for the first commission of any such offense, be fined under title 18 or imprisoned not more than 6 months, or both, and, for a subsequent commission of any such offense, be fined under title 18, or imprisoned not more than 2 years, or both.
(b) Improper time or place; civil penalties
Any alien who is apprehended while entering (or attempting to enter) the United States at a time or place other than as designated by immigration officers shall be subject to a civil penalty of—
(1) at least $50 and not more than $250 for each such entry (or attempted entry); or
(2) twice the amount specified in paragraph (1) in the case of an alien who has been previously subject to a civil penalty under this subsection.
Civil penalties under this subsection are in addition to, and not in lieu of, any criminal or other civil penalties that may be imposed.
The term alien was used in United States law just after our country was founded. The Alien and Sedition Acts of 1798 consisted of four bills enacted into law. The Naturalization Act made it more difficult for an immigrant to become a citizen. The Alien Friends Act allowed the president to imprison and deport dangerous non-citizens. The Sedition Act allowed the president to imprison and deport dangerous non-citizens who were from a hostile nation. It also criminalized making false statements that were critical of the federal government.
Illegal Alien
An illegal alien is defined in the Department of Homeland Security Media Resources Glossary as "A foreign national who (a) entered the United States without inspection or with fraudulent documentation or (b) who, after entering legally as a non-immigrant, violated status and remained in the United States without authority."
Thus, an illegal alien is "a foreigner who has entered or resides in a country unlawfully or without the country's authorization." An illegal alien is an alien - that is, a foreign national - who has illegally entered the United States, or who enters legally and then deliberately overstays their visa. An illegal alien is a criminal subject to as much as six months in jail for first offense and subject to federal felony charges for subsequent entries after initial deportation. (From What is an alien?, Juan Mann's Frequently Asked Questions About Immigration and the Law, VDare.com, 11 December 2002.)
The term illegal alien was coined by a Federal Appeals Court in 1950.
Colorado defines an illegal alien as "anyone who has entered the United States illegally and is deportable, or anyone who has 'overstayed a visa' or otherwise violated the terms of his or her legal admission into the United States. Sometimes known as an 'illegal immigrant.'" (From Implementation of Senate Bill 06-090 Performance Audit, Colorado State Auditor, Department of Public Safety, Department of Local Affairs, May 2009.)
U.S. Government law and legal definitions
Laws, Regulations, and Guides Immigration and Nationality Act, summary by the U.S. Citizenship and Naturalization Services:
The Immigration and Nationality Act, or INA, was created in 1952. Before the INA, a variety of statutes governed immigration law but were not organized in one location. The McCarran-Walter bill of 1952, Public Law No. 82-414, collected and codified many existing provisions and reorganized the structure of immigration law. The Act has been amended many times over the years, but is still the basic body of immigration law.
The INA is divided into titles, chapters, and sections. Although it stands alone as a body of law, the Act is also contained in the United States Code (U.S.C.). The code is a collection of all the laws of the United States. It is arranged in fifty subject titles by general alphabetic order. Title 8 of the U.S. Code is but one of the fifty titles and deals with "Aliens and Nationality". When browsing the INA or other statutes you will often see reference to the U.S. Code citation. For example, Section 208 of the INA deals with asylum, and is also contained in 8 U.S.C. 1158. Although it is correct to refer to a specific section by either its INA citation or its U.S. code, the INA citation is more commonly used.
Title 8, Code of Federal Regulations, summary by the U.S. Citizenship and Naturalization Services:
The general provisions of laws enacted by Congress are interpreted and implemented by regulations issued by various agencies. These regulations apply the law to daily situations. After regulations are published in the Federal Register, they are collected and published in the Code of Federal Regulations, commonly referred to as the CFR. The CFR is arranged by subject title and generally parallels the structure of the United States Code. Thus, Title 8 of the CFR deals with "Aliens and Nationality", as does Title 8 of the U.S. Code.
Search 8 U.S.C. § 1101 : US Code - Section 1101: Definitions, Findlaw, 13 April 2016:
(3) The term "alien" means any person not a citizen or national of the United States.
(15) The term "immigrant" means every alien except an alien who is within one of the following classes of nonimmigrant aliens... (F)(i) an alien having a residence in a foreign country which he has no intention of abandoning, who is a bona fide student qualified to pursue a full course of study and who seeks to enter the United States temporarily and solely for the purpose of pursuing such a course of study...
8 U.S. Code § 1365 – Reimbursement of States for costs of incarcerating illegal aliens and certain Cuban nationals
(a) Reimbursement of States
Subject to the amounts provided in advance in appropriation Acts, the Attorney General shall reimburse a State for the costs incurred by the State for the imprisonment of any *illegal alien or Cuban national who is convicted of a felony by such State.
(b) *Illegal aliens convicted of a felony
An *illegal alien referred to in subsection (a) of this section is any alien who is any alien convicted of a felony who is in the United States unlawfully...
INA: Act 274A - Unlawful Employment of Aliens: Sec. 274A. [8 U.S.C. 1324a].
Definition of unauthorized alien. As used in this section, the term "unauthorized alien" means, with respect to the employment of an alien at a particular time, that the alien is not at that time either (A) an alien lawfully admitted for permanent residence, or (B) authorized to be so employed by this Act or by the Attorney General.
Inspection and Expedited Removal of Aliens Detention and Removal of Aliens; Conduct of Removal Proceedings; Asylum Procedures [62 FR 10312] [FR 10-97].
Internal Revenue Service: Taxation of Nonresident Aliens: An alien is any individual who is not a U.S. citizen or U.S. national. A nonresident alien is an alien who has not passed the green card test or the substantial presence test...
U.S. Government usage of terminology
The legal terms "alien" and "illegal alien" are used extensively in U.S. government publications. Some, but certainly not all, usages are included below.
Usage by the U.S. Citizenship and Naturalization Services: Glossary of Terms
From the U.S. Citizenship and Naturalization Services, Glossary of Terms, 10 April 2016:
Alien: Any person not a citizen or national of the United States. From U.S. Citizenship and Naturalization Services, Glossary of Terms, 10 April 2016.
Legalized Aliens, U.S. Citizenship and Naturalization Services, Glossary of Terms, 10 April 20166:
Certain illegal aliens who were eligible to apply for temporary resident status under the legalization provision of the Immigration Reform and Control Act of 1986. To be eligible, aliens must have continuously resided in the United States in an unlawful status since January 1, 1982, not be excludable, and have entered the United States either 1) illegally before January 1, 1982, or 2) as temporary visitors before January 1, 1982, with their authorized stay expiring before that date or with the Government’s knowledge of their unlawful status before that date. Legalization consists of two stages--temporary and then permanent residency. In order to adjust to permanent status aliens must have had continuous residence in the United States, be admissible as an immigrant, and demonstrate at least a minimal understanding and knowledge of the English language and U.S. history and government.
Permanent Resident Alien, U.S. Citizenship and Naturalization Services, Glossary of Terms, 10 April 2016:
An alien admitted to the United States as a lawful permanent resident. Permanent residents are also commonly referred to as immigrants; however, the Immigration and Nationality Act (INA) broadly defines an immigrant as any alien in the United States, except one legally admitted under specific nonimmigrant categories (INA section 101(a)(15)). An illegal alien who entered the United States without inspection, for example, would be strictly defined as an immigrant under the INA but is not a permanent resident alien. Lawful permanent residents are legally accorded the privilege of residing permanently in the United States. They may be issued immigrant visas by the Department of State overseas or adjusted to permanent resident status by U.S. Citizenship and Immigration Services in the United States.
Resident Alien, U.S. Citizenship and Naturalization Services, Glossary of Terms, 10 April 2016:
Applies to non-U.S. citizens currently residing in the United States. The term is applied in three different manners; please see Permanent Resident, Conditional Resident, and Returning Resident
The formal removal of an alien from the United States when the alien has been found removable for violating the immigration laws. Deportation is ordered by an immigration judge without any punishment being imposed or contemplated. Prior to April 1997 deportation and exclusion were separate removal procedures. The Illegal Immigration Reform and Immigrant Responsibility Act of 1996 consolidated these procedures. After April 1, 1997, aliens in and admitted to the United States may be subject to removal based on deportability. Now called Removal, this function is managed by U.S. Immigration and Customs Enforcement.
Usage by Congress in the DREAM Act
The Dream Act is an acronym for Development, Relief, and Education for Alien Minors. The bill was introduced in the Senate in 2001. Although it was reintroduced several times, the bill has consistently failed to pass.
Usage by the U.S. Citizenship and Immigration Services: Services Help Center
Questions related to: "Unaccompanied Alien Child", 10 April 2016:
Who is an Unaccompanied Alien Child (UAC)? Unaccompanied Alien Child (UAC) is a legal term referring to a child who: has no lawful immigration status in the United States; has not attained 18 years of age; and has no parent or legal guardian in the United States, or for whom no parent or legal guardian in the United States is available to provide care and physical custody.
Usage by the U.S. Citizenship and Immigration Services: various
USCIS Service and Office Locator: Other Government Agencies Involved in the Immigration Process, 13 April 2016:
Immigration Investigations, Enforcement, Detention and Removal:
For information about immigration investigations, enforcement, detention or removal of aliens from the U.S., or to report suspected illegal aliens or other illegal immigration activity, please visit the United States Immigration and Customs Enforcement website at www.ice.gov
Penalties: Employers must not: Hire, recruit for a fee, or refer for a fee aliens he or she knows to be unauthorized to work in the United States.
Sponsor: There are many ways to sponsor an alien.
Information for Employers and Employees: If the alien is not already a permanent resident, you will need to file a petition... No alien may accept employment in the United States unless they have been authorized to do so... Aliens employed in the U.S. may have a U.S. tax obligation.
Petition Filing and Processing Procedures for Form I-140, Immigrant Petition for Alien Worker.
Title 8, Code of Federal Regulations: Title 8 of the CFR deals with "Aliens and Nationality", as does Title 8 of the U.S. Code.
Usage by the Department of Homeland Security: Media Resources Glossary
From the Department of Homeland Security Media Resources Glossary, 10 April 2016:
Illegal Alien - A foreign national who (a) entered the United States without inspection or with fraudulent documentation or (b) who, after entering legally as a non-immigrant, violated status and remained in the United States without authority.
Usage by the Internal Revenue Service
Immigration Terms and Definitions Involving Aliens, IRS, 13 April 2016:
Alien: An individual who is not a U.S. citizen or U.S. national.
Immigrant: An alien who has been granted the right by the USCIS to reside permanently in the United States and to work without restrictions in the United States.
Nonimmigrant: An alien who has been granted the right by the USCIS to reside temporarily in the United States.
Illegal Alien: Also known as an "Undocumented Alien," is an alien who has entered the United States illegally and is deportable if apprehended, or an alien who entered the United States legally but who has fallen "out of status" and is deportable.
Taxation of U.S. Resident Aliens: Taxable Income: A U.S. resident alien's income is generally subject to tax in the same manner as a U.S. citizen. If you are a U.S. resident alien... U.S. resident aliens can claim the same itemized deductions as U.S. citizens.
Taxation of Nonresident Aliens: An alien is any individual who is not a U.S. citizen or U.S. national. A nonresident alien is an alien who has not passed the green card test or the substantial presence test... If you are any of the following, you must file a return: A nonresident alien individual engaged or considered to be engaged in a trade or business in the United States during the year.
Nonresident aliens who are required to file an income tax return must use: Form 1040NR, U.S. Nonresident Alien Income Tax Return, or Form 1040NR-EZ, U.S. Income Tax Return for Certain Nonresident Aliens With No Dependents.
For additional details, refer to When To File in the Filing Information chapter of Publication 519, U.S. Tax Guide for Aliens.
Usage by the U.S. Court of Appeals
On November 9, 2015, the 5th U.S. Circuit Court of Appeals in New Orleans ruled against Obama's immigration plan. Read the ruling here. The ruling contains approximately 39 references to the term illegal alien. Footnote 14 on pages 4-5 explains the terminology:
14. Although “[a]s a general rule, it is not a crime for a removable alien to remain present in the United States,” it is a civil offense. Arizona v. United States, 132 S. Ct. 2492, 2505 (2012); see 8 U.S.C. §§ 1182(a)(9)(B)(i), 1227(a)(1)(A)–(B). This opinion therefore refers to such persons as “illegal aliens”:
The usual and preferable term in [American English] is illegal alien. The other forms have arisen as needless euphemisms, and should be avoided as near-gobbledygook. The problem with undocumented is that it is intended to mean, by those who use it in this phrase, “not having the requisite documents to enter or stay in a country legally.” But the word strongly suggests “unaccounted for” to those unfamiliar with this quasi-legal jargon, and it may therefore obscure the meaning.
More than one writer has argued in favor of undocumented alien . . . [to] avoid[] the implication that one’s unauthorized presence in the United States is a crime . . . . Moreover, it is wrong to equate illegality with criminality, since many illegal acts are not criminal. Illegal alien is not an opprobrious epithet: it describes one present in a country in violation of the immigration laws (hence “illegal”).
BRYAN A. GARNER, GARNER’S DICTIONARY OF LEGAL USAGE 912 (Oxford 3d ed. 2011) (citations omitted). And as the district court pointed out, “it is the term used by the Supreme Court in its latest pronouncement pertaining to this area of the law.” Dist. Ct. Op., 86 F. Supp. 3d at 605 n.2 (citing Arizona v. United States, 132 S. Ct. 2492, 2497 (2012)). “[I]legal alien has going for it both history and well-documented, generally accepted use.” Matthew Salzwedel, The Lawyer’s Struggle to Write, 16 SCRIBES JOURNAL OF LEGAL WRITING 69, 76 (2015).
Usage in the U.S. Supreme Court
Plyler v Doe, Decided: 15 June 1982
(a) The illegal aliens who are plaintiffs in these cases challenging the statute may claim the benefit of the Equal Protection Clause, which provides that no State shall “deny to any person within its jurisdiction the equal protection of the laws.” Whatever his status under the immigration laws, an alien is a “person” in any ordinary sense of that term. This Court’s prior cases recognizing that illegal aliens are “persons” protected by the Due Process Clauses of the Fifth and Fourteenth Amendments...
Arizona Chamber of Commerce v. Whiting - When the U.S. Chamber of Commerce teamed up with the ACLU and La Raza to kill the Arizona E-Verify law designed to protect jobs and wages from illegal aliens:
Wikipedia: “Chamber of Commerce v. Whiting was a United States Supreme Court case which dealt with the question of whether the Legal Arizona Workers Act was invalid under federal statutes, in particular the Immigration Reform and Control Act. On May 26, 2011, the Supreme Court ruled, in a 5-3 decision, that The Legal Arizona Workers Act was not preempted by federal legislation...
Illegal alien was used three (3) times. Once by Justice Sonia Sotomayor
Arizona v. United States (2012)
“Illegal alien” is used either ten or eleven times and seven or eight times by Sotomayor.
Usage in Presidential Executive Orders
High Seas Interdiction of Illegal Aliens: Proclamation No. 4865, Ronald Reagan, 29 September 1981, 46 F.R. 48107.
Interdiction of Illegal Aliens, Executive Order No. 12807, George Bush, 1992.
Presidential statements
Colorado law and legal definitions
Implementation of Senate Bill 06-090, Department of Public Safety, Department of Local Affairs, Performance Audit, May 2009:
Glossary: Illegal Alien - anyone who has entered the United States illegally and is deportable, or anyone who has “overstayed a visa” or otherwise violated the terms of his or her legal admission into the United States. Sometimes known as an “illegal immigrant.”
Prohibits local governments from enacting such policies. In addition, the bill requires local law enforcement personnel to report suspected illegal aliens to the u.s. Immigration and customs enforcement office.
House Bill 06-1343 - Article 17.5 Illegal Aliens - Public Contracts for Services:
Concerning measures to ensure that an illegal alien does not perform work on a public contract for services, and making an appropriation in connection therewith.
House Bill 06s-1009 deny business permits to illegal aliens
(d) "unauthorized alien" has the same meaning as set forth in 8 u.s.c. Sec. 1324a (h) (3).
Issue Brief number 06-04 a legislative council publication, 26 May 2006:
Immigration in Colorado: state impact and recent legislation
One study estimated the number of illegal alien students in Colorado at 25,000 in 2000. Based on this estimate adjusted for the growth in Colorado's population between 2000 and 2004, Colorado schools expended approximately $157.9 million to educate undocumented alien students in fy 2003-04.
References
Illegal alien, illegal alien, illegal alien – save this for when the illegal alien lobby tells you there is no such legal term as “illegal alien”, D.A. King, The Dustin Inman Society, 10 November 2015.
U.S. Appeals Court consistently uses the correct terminology 'illegal alien', CAIRCO, 10 November 2015.
It’s Official–A Federal Appeals Court Coined The Term “Illegal Alien” In 1950, Paul Nachman, VDare, 19 October 2015.
Opposition To ‘Illegal Aliens’ Is Opposition To Borders, by Jon Feere, Legal Policy Analyst, Center for Immigration Studies, Daily Caller, 25 May 2016.
Those who are driving the effort to control and contort language in the immigration debate are not truly motivated by the notion that the term “illegal alien” is a pejorative. This is a distraction. The real goal of those demanding that media outlets, courts, and now the Library of Congress supplant accurate legal terminology with activist-created terms is to eradicate the distinction between citizen and non-citizen, between legal activity and illegal activity, between “us” and “them” so that the concept of borders and the nation state slowly slip away. Any official heading an organization or governmental agency who thinks they are being sensitive by bowing to demands to alter their use of language is being played by the open-border crowd...
In reality, we’re a nation of citizens. And as citizens, we have a right to decide who gets to immigrate here, how many people get to immigrate here, and also set the conditions they must abide by if they want to stay. Anything less than that destroys the concept of citizenship and sovereignty. Media shouldn’t help the open-border crowd achieve its goal.
Justice Department Ends Use of Term 'Undocumented' Instead of 'Illegal Alien', Breitbart, 25 July 2018.
An immigrant's perspective on terminology: “Comments Disabled”—Ruling Class Immigration Enthusiasm Pushing U.S. Into Oriental “Beggar’s Democracy”, VDare, 15 June 2019.
"Undocumented Immigrant" Is a Made-Up Term That Ignores the Law, by Hans Von Spokavy, 30 July 2018.
Illegal Aliens Who Apply For Asylum Are And Remain Illegal Aliens, by Federale, 5 January 2023.
The Political Spectrum
The political spectrum is a representation of differing political positions in relation to each another. The following graph correlates increasing government power with decreasing individual freedom:
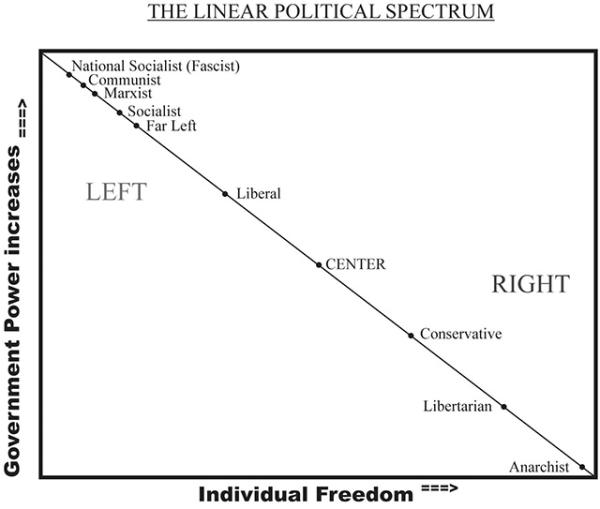
Another familiar representation is the traditional horizontal axis representing left - moderate - right. The more complex spectrum developed by Dickenson shows how various political positions relate to each other:1

The following graphic contrasts Left vs Right values and perspectives:

Definitions for terms describing political positions, such as "progressive," "liberal," and "conservative" are not universally accepted. Political scientist and philosopher W.B. Gallie calls them contested concepts:3
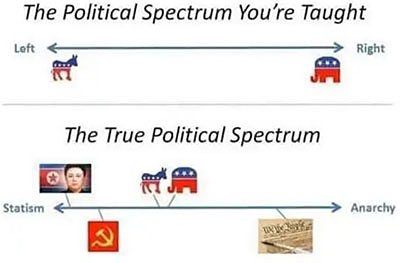
Sources
1. What are ‘Liberals,’ What are ‘Progressives,’ and Why the Difference Matters, Crissie Brown, PoliticsUSA, June 15, 2013.
2. Political spectrum, Rational Wiki.
3. Contested Concepts in Cognitive Social Science, Alan Schwartz, University of California, Berkeley, May 1992.
Here is more information on the political spectrum in context of today's political environment:
A Primer on American Liberty
From The Patriot's Primer on American Liberty:
The mission of this indispensable pocket resource on Liberty, "endowed by [our] Creator," is to provide a foundational understanding of Liberty, so that today's generation of Americans can more effectively "Support and Defend" the unalienable Rights of Mankind as enumerated in our Declaration of Independence and enshrined in our Republic's Constitution.
The Primers are an essential scholastic resource for Americans of all ages - students, grassroots organizations, civic clubs, military personnel and first responders, professional associations and other groups. It includes a comprehensive introduction to American Liberty by Mark Alexander, summarizing the historical struggle between Liberty and tyranny -and the primacy of Rule of Law over rule of men necessary to sustain Liberty.
The Patriot's Primer on American Liberty
Table of Contents
The Patriot's Primer on American Liberty
Sons of Liberty — The Fight for Freedom
"Endowed by Their Creator"
"We Resolve to Conquer or Die"
"We the People"
"To Secure These Rights"
"An Evil of Colossal Magnitude"
Rule of Law
The Rule of Men
A "Wall of Separation"?
"The Palladium of the Liberties of the Republic"
"The Powers Not Delegated."
"A Republic, if You Can Keep It"
The Rise of Statism and the Welfare State
Principium Imprimis — Restoring First Principles
Extending Our Legacy of Liberty to the Next Generation
A Time for Choosing
Another Time for Choosing
Liberty or Tyranny?
The Declaration of Independence
The Constitution
Preamble & Article I
Article II
Article III
Article IV
Article V
Article VI
Article VII
Amendments to the Constitution
The Preamble to The Bill of Rights
The Bill of Rights (Amendments I - X)
Amendments XI - XXVII
Questions
Chronology
Resources
Our Turning Point: Either a Liberal or Progressive America
America is at a turning point. The paradigm of progressivism - that is, of socialism / Marxism - is threatening traditional American liberalism. Many Americans intuitively understand that America is undergoing a fundamental transformation, but they don't understand what it is, or why the transformation is taking place.
The following article superbly presents why America is at a crossroads and how we must preserve American liberalism and Western Civilization while we still can. The article is well worth reading in its entirety. Excerpts are included below.
Our 1776 Moment: Either a Liberal or Progressive America
We live at a "1776 Moment" where our governing principles, law, and society are changing into something America has never known.
by Bradley A. Thayer, American Greatness, 22 January 2022.
... The United States is at a "1776 Moment" of ideological transformation. The American Revolution of 1776 marked a change of political ideology from constitutional monarchy to liberalism. Today, the ideological transformation is from liberalism to progressivism....
The American Ideology of Liberalism
Historically, the United States has possessed a single dominant ideology of liberalism... Liberalism is a political ideology that promises liberty for the individual. It employs the concept of inalienable rights and individual freedoms. These ideas and principles are expressed in America’s founding documents...
U.S. political institutions encompass liberal principles, values, norms, and culture. These include the ideas that animate liberalism—freedom, private property, respect for the rule of law, citizenship, and patriotism—and thus the country’s formal political institutions....
For liberalism to work, the power of government must be controlled. It is limited, first, through the separation of powers...
... it was the political ideology of liberalism that unified all Americans, including later immigrants....
In the American context, while "liberals" and "conservatives" had their policy differences, both camps were classically liberal in their general outlook. Other ideologies, such as socialism, arose out of foreign philosophies and experiences that were alien to the American experience...
Progressivism and the History of Communist Thought
A symptom of our "1776 Moment" is that the Democrats, once stalwart liberals, have become progressives, which means, in fact, they have become socialists. Progressivism’s origins are found in the thought of Karl Marx and Friedrich Engels....
In the West, Italian communist Antonio Gramsci and in Germany the Institute of Social Research, known as the Frankfurt School, argued independently of each other that culture would be the instrument of revolution in the West....This revolution could be executed over decades of gradual change....
The educational system, in particular, was of central importance to shape subsequent generations...
Independently from Gramsci, the Frankfurt School—most significantly Theodor Adorno, Erich Fromm, Max Horkheimer, and Herbert Marcuse—advanced a similar message for advancing communism in the West.... This would evolve into critical theory....
The family, as the "germ cell" of bourgeois culture, had to be undermined, destroyed, and reconstituted...
... these dogmas promote the liberation sought by critical theory—liberation of those who were once oppressed—and the destruction and replacement of liberalism and traditional American identity, values, and principles. Here are the seeds of "hate speech" laws and speech codes to... control thought and expression....
Third, progressivism is totalizing... which means that there can be no opposition or allowance of alternative political choices or political thought...
Fourth, liberalism’s individualism is replaced with group identification...
Fifth, progressives replace meritocracy with equity so that principle of outcome supplants that of using talent and skill to gain a position....
Sixth, progressivism seeks to replace liberalism and American political culture and history with progressivism’s principles, culture, and history...
CRT [Critical Race theory] serves as the mechanism to accelerate revolutionary change....
The Consequences
The impact of progressivism is revolutionary: the replacement of liberal ideology and culture with its Marxist alternative.... The beneficiaries are America’s enemies, most significantly China, which watches with glee while the United States tears apart the sources of its great strength....
... Americans do not know which should be obeyed, or perhaps even which is legitimate. Moreover, there is a generational divide....
The consequence of the "1776 Moment" is that the United States will either sustain liberalism as its ideology or become a totalitarian country. The plan of progressivism is clear. To prevent it requires a renaissance of liberalism to assert America’s political ideology, culture, and history....
About Bradley A. Thayer
Bradley A. Thayer is the co-author of How China Sees the World: Han-Centrism and the Balance of Power in International Politics, and author of Darwin and International Relations and the forthcoming Understanding the China Threat.
Related
The Cloward–Piven strategy - a tool for fundamentally transforming America, by Fred Elbel.
Unprecedented - Western civilization at the crossroads, by Michael Anton, The New Criterion, 5 December 2021.
How Marxists Captured the Universities and Will Soon Capture the Nation, by Doug Casey, International Man / Lou Rockwell, 26 December 2021.
Totalitarianism and the Five Stages of Dehumanization, by Christiaan W.J.M. Alting von Geusau, Burning Platform, 21 November 2021.
The Greatest Existential Threat to America, by David Horowitz, FrontPage Mag, 14 September 2021.
The Hundred-Year Road To CRT - Critical Race theory, by Larry Sand, American Greatness, 29 August 2021.
5 minute video: Totalitarianism: Can It Happen in America?, by Rod Dreher, PragerU, 3 January 2022: What does totalitarianism look like? In the 20th century, it took the form of secret police violently silencing anyone who spoke out against the government. Now, it has a very different face — one we should be wary of just the same. Rod Dreher, author of Live Not By Lies, explains.
An overview of the ten ideologies of America
The following article presents a good overview: The Ten Ideologies of America: As Donald Trump Overthrows the Old Order, a Look at the New, by Virgil, Breitbart, March 20, 2016. The entire article is a good read. Here are some excerpts:
- Cosmopolitanism
- Establishmentism
- Green Malthusianism
- Leftism
- Libertarianism
- Libertinism
- Nationalism
- Neoconservatism
- Paleoconservatism
- Populism
Bull Moose Progressives and the liberal paradigm
Bull Moose Progressives
When President McKinley was assassinated in 1901, Theodore Roosevelt at age 42 became the youngest President in history. As the 25th President of the United States, Roosevelt held office from 1901 until 1909. He lead the country into the Progressive Era, and championed a "Square Deal" for Americans. The Progressive party called for major reforms including breaking trusts, women's suffrage, railroad regulation, worker's compensation, farm relief, and pure food and drugs.
Roosevelt highly valued conservation. He established new national monuments, parks, and forests with the intent of preserving America's natural resources. He began construction of the Panama Canal.
When asked whether he was fit to be president in 1912, he responded that he was as fit as a "bull moose." The name stuck.
The Platform of the Progressive Party, August 7, 1912, reads in part:
...This country belongs to the people who inhabit it. Its resources, its business, its institutions and its laws should be utilized, maintained or altered in whatever manner will best promote the general interest...
The Old Parties
Political parties exist to secure responsible government and to execute the will of the people.
From these great tasks both of the old parties have turned aside. Instead of instruments to promote the general welfare, they have become the tools of corrupt interests which use them impartially to serve their selfish purposes. Behind the ostensible government sits enthroned an invisible government, owing no allegiance and acknowledging no responsibility to the people.
To destroy this invisible government, to dissolve the unholy alliance between corrupt business and corrupt politics is the first task of the statesmanship of the day.
The deliberate betrayal of its trust by the Republican Party, and the fatal incapacity of the Democratic Party to deal with the new issues of the new time, have compelled the people to forge a new instrument of government through which to give effect to their will in laws and institutions.
Unhampered by tradition, uncorrupted by power, undismayed by the magnitude of the task, the new party offers itself as the instrument of the people to sweep away old abuses, to build a new and nobler commonwealth.
A Covenant with the People
This declaration is our covenant with the people, and we hereby bind the party and its candidates in State and Nation to the pledges made herein.
The Rule of the People
The Progressive Party, committed to the principle of government by a self-controlled democracy expressing its will through representatives of the people, pledges itself to secure such alterations in the fundamental law of the several States and of the United States as shall insure the representative character of the Government.
In particular, the party declares for direct primaries for nomination of State and National officers, for Nation-wide preferential primaries for candidates for the Presidency, for the direct election of United States Senators by the people; and we urge on the States the policy of the short ballot, with responsibility to the people secured by the initiative, referendum and recall.
Reflecting on the platform, it appears that special interests and political corruption were as much of an issue one hundred years ago as they are today.
Liberalism
Liberalism in American can be considered a political ideology which is framed by values that include equal opportunity, freedom of thought, individual freedom, and democratic government. Government intervention is typically embraced as the mechanism by which these values are implemented and enforced.
The Heritage Foundation notes that:
The Progressives were united in their contempt for what they called the "individualism" of the Founding. Instead of a government that protects natural rights through limited, decentralized powers, they envisioned an expansive government, a "living" and evolving Constitution, and the rule of "experts" in nationally centralized administrative agencies...
Whereas the Founders believed the government had a well-defined and limited role to play in the lives of citizens - essentially leaving people alone to lead their lives - the Progressives favored a much more active role for the government in overseeing civil society, regulating the economy, and redistributing wealth.
These two fundamentally different understandings of the role of government grow out of two different understandings of freedom. For the Progressives, freedom is not secured when government protects natural rights and otherwise leaves citizens to rule themselves. True freedom, by this view, demands an active government that provides equal means to self-fulfillment for all. It is not enough to create the conditions that allow people to pursue their own happiness - equal opportunity - since some citizens start with more advantages than others. Government must set out to level the playing field and determine outcomes...
Liberalism can be understood in two very different ways. Liberalism, or what some call "classical liberalism," is a political philosophy based on individual liberty and limited government. Over the last century, however, liberalism has come to take on a different meaning. The contemporary understanding of liberalism is based not on individual liberty, but on the use of government to grant benefits and advantages in order to give everyone the ability to achieve a certain standard of living and reduce inequalities. Therefore, modern liberalism encourages an extensive network of interest groups that receive benefits from government and organize in order to preserve those benefits.
Modern liberalism grows out of the Progressive rejection of American constitutionalism and an embrace of a new conception of freedom, anchored in big government.
The Progressive versus Liberal paradigm
Philosopher and political scientist W.B. Gallie called the terminology of "progressive" and "liberals" contested concepts:
...concepts the proper use of which inevitably involves endless disputes about their proper uses on the part of their users [that] cannot be settled by appeal to empirical evidence, linguistic usage, or the canons of logic alone.
There is no singularly accepted definition for these terms. In the article What are 'Liberals,' What are 'Progressives,' and Why the Difference Matters, Crissie Brown notes that:
More recently, cognitive linguists have explored contested concepts in the context of frame semantics... That is, we define words relative to other ideas that come to mind when we hear, read, or think about them. Those other ideas form the "frame" within which we find meaning for a word. Both "liberal" and "progressive" exist in the POLITICS frame and - in the U.S. - both imply opposition to "conservative." Add to that the fact that conservatives have for decades used "liberal" as an epithet, and many people have come to believe that "progressive" is simply a euphemism for "liberal." But those two terms have different histories and hallmarks.
Brown points out that:
Liberalism is a set of ideals grounded in the social contract (rule by consent of the governed for mutual benefit), both negative liberty (freedom from unreasonable interference) and positive liberty (access to basic resources to pursue one's goals), and both equality in law (legal rights and privileges), and equality of opportunity (social mobility). Liberalism is an ideology, and over three hundred years of history have shown that it can be robust and successful. Indeed the past three centuries can reasonably be summarized as the rise and spread of liberal ideals.
Brown notes that not all progressives are liberal:
Progressivism is a problem-solving method. Historians generally date Progressive Era as 1890-1920, but the progressive method did not end with that date. The progressive method is not an ideology but a pragmatic search for solutions that work, grounded in a healthy skepticism.
Thus, for example, Prohibition was a progressive project and was based on the social science of that era , but 'The Great Experiment' of Prohibition failed in practice and progressives also worked for its repeal. The 20th century can reasonably be summarized as the rise and spread of the progressive method.
In support of Progressivism, Brown observes that:
In short, it's not enough to practice the progressive method. That method must be applied toward goals grounded in liberal ideals, and it we must recognize when it's time to 'fish or cut bait' and be willing to advocate the best solutions we can find with confidence, even as we recognize that we will need to adapt to new information and changing conditions.
Liberalism is intolerant of liberty
In the essay The Sinking Ship Of Liberalism, Xiang Yu aptly observes that liberalism can not tolerate liberty, because liberty enables inequality of outcome:
.. But it must be said: the very freedom of the liberal society allows for the destruction of that liberal society, especially via the ballot box. In a liberal democracy, after all, the majority (or rather those who influence the passions of that majority) has absolute power over state and society, and there is no ironclad rule that the majority must vote for liberal ideals forever, making it inevitable that charlatans or fanatics will seek to use the masses to realize their own ideologies...
This growing chasm between liberalism and democracy has been expounded upon, in different forms, by many thinkers far more eminent than myself...
It is through these disparate analyses of conflict that we can make out the form of one liberalism’s most determined and fanatical adversaries, not that of reaction, but rather, leftism. Leftism is not a new phenomenon and has reared its head in countless nations and epochs throughout human history, from ancient Chinese Agriculturalism to the English Diggers to the Jacobins to Lenin, with the common theme of doing away with any inequality by any means whatsoever. The leftist’s claim to legitimacy in all of this is essentially democratic in nature: only he really cares about the people’s well being, only he knows their best interest, even if they themselves have been deceived as to just what that is; he represents the majority. He is the General Will.
For the leftist, liberal buzzwords about civility, merit, moderation, and limited government are just constructs created by an immoral class seeking to preserve its privilege in the face of the leveling that is the only just way to order the world. The liberty the liberal so cherishes cannot be allowed by the leftist to persist in any form because it might be used to perpetuate that most odious of sins, inequality....
Thus liberalism is incompatible with America's form of government - a Constitutional Republic which presupposes equality of opportunity but allows for inequality of outcome. For example, individuals are allowed the freedom to work diligently at a chosen profession, but some may succeed magnificently while others may fail.
Liberalism (which is sometimes called leftism) demands equality of outcome, and therein lies the inconsistency.
Three Dimensions of Ideology: "Conservatives View Things Along A Civilized/Barbaric Axis…", by John Derbyshire, 20 January 2013:
Conservatives view things along a civilized/barbaric axis, liberals along an oppressed/oppressor axis, and libertarians along a freedom/coercion axis. Conservatives will thus favor things that correlate well with (in particular, Western) civilization, while opposing things that correlate with poorly civilized societies or that would directly contradict salient features of civilization. Progressives, on the other hand, don't care about civilization - they care about defending the oppressed and opposing the oppressors. The "civilized" side can be the wrong side if it's taking on the role of an oppressor. And Libertarians don't see civilization or oppressors - they only want to know if someone is being coerced to do something - that's the wrong side.
References
1. Theodore Roosevelt, Wikipedia.
2. Bull Moose Party - The Progressive Party of 1912, American History.
3. Platform of the Progressive Party, 7 August 1912.
4. Progressivism and Liberalism, The Heritage Foundation
5. What are ‘Liberals,’ What are ‘Progressives,’ and Why the Difference Matters, Crissie Brown, PoliticsUSA, 15 June 15 2013.
6. How to tell the difference between a progressive and a liberal.
7. What is Progressive?, Andrew Garb, Alternet, 25 July 25 2005.
8. Yes, the Left Stole Liberalism & Sold Out the West, by Ilana Mercer, Unz Review, 16 August 2018.
9. The Sinking Ship Of Liberalism, by Xiang Yu, Social Matter, 8 November 2018.
10. Video: The Left Ruins Everything, by Dennis Prager, Prager U, 25 March 2019.
11. The Cultural Divide, by F Elbel, 12 October 2022.
Neoliberalism
Neoliberalism (or neo-liberalism) originated as an European economic philosophy in the 1930s. The intent was to bridge the conflicting ideologies of classical liberalism and socialist planning in order to avoid economic failures like those which occurred in the early 1930s. Neoliberalism at first referred to theories at odds with classical liberal laissez-faire doctrine. It promoted a market economy guided by a strong state, which was referred to as the social market economy.
During this 1980s the term gained a negative connotation. The term shifted to mean a more radical laissez-faire economic approach. Scholars began to associate neoliberalism with Milton Friedman and Friedrich Hayek. Neoliberalism currently refers to market-oriented policies such as deregulating capital markets, eliminating price controls, lowering trade barriers, and reducing state influence on the economy - especially through privatization and austerity.
This new meaning of neoliberalism is common among Spanish-speaking scholars, but the term is used less frequently in the United States.
References
Neoliberalism, Wikipedia.
What is Neoliberalism? A Brief Definition for Activists, by Elizabeth Martinez and Arnoldo Garcia, Global Exchange, February 26th, 2000.
What is Neoliberalism, Investopedia.
Conservatism, Paleoconservatism, and Neoconservatism
Conservatism
Conservatism is a political approach which promotes retaining social institutions in the context of civilization and culture. Quintin Hogg, chairman of the British Conservative Party in 1959, "Conservatism is not so much a philosophy as an attitude, a constant force, performing a timeless function in the development of a free society, and corresponding to a deep and permanent requirement of human nature itself."1
Conservatism has different meanings and traditions in different countries. Conservative political parties vary from country to country depending on their goals and objectives, and often define themselves by their opposition to liberal agendas.
Conservatism in the United States is rooted in the American Revolution and its commitment to sovereignty of the people, republicanism, and individual rights and liberties. Most European conservatives consider American conservatism to be a variety of liberalism and do not think of it as genuine conservatism.1
- Liberal conservatism: combines conservative values and policies with classical liberal positions.
- Conservative liberalism: combines liberal values and policies with conservative positions.
- Libertarian conservatism: in the United States, combine libertarian economic issues with other aspects of conservatism.
- Fiscal conservatism: economic philosophy of prudence in government spending and debt.
- National and traditional conservatism: in Europe, concentrates more on national interests.
- Cultural and social conservatism: preserving the heritage of a nation or a shared culture.
- Religious conservatism: seeks to apply the teachings of particular religions to politics.
- Progressive conservatism: stresses the importance of a social safety net and supports limited redistribution of wealth along with government regulation.1
Paleoconservatism
In the United States, Paleoconservatism stresses tradition, limited government, civil society, along with religious, national, and regional Western identity. Paleoconservatives disagree with neoconservatives, on issues such as illegal immigration, high rates of legal immigration, multiculturalism, affirmative action, foreign aid, and free trade. They also criticize social democracy and social welfare, referring to it as the "welfare-warfare state"2 As such, they may be considered "classical conservatives."
Paleocons typically take the "long view" toward US conservatism. Samuel T. Francis observed that:
What paleoconservatism tries to tell Americans is that the dominant forces in their society are no longer committed to conserving the traditions, institutions, and values that created and formed it, and, therefore, that those who are really conservative in any serious sense and wish to live under those traditions, institutions, and values need to oppose the dominant forces and form new ones...
We believe that the United States derives from and is an integral part of European civilization and the European people and that the American people and government should remain European in their composition and character... We believe that illegal immigration must be stopped, if necessary by military force and placing troops on our national borders; that illegal aliens must be returned to their own countries; and that legal immigration must be severely restricted or halted through appropriate changes in our laws and policies.2
Paleoconservatives contend that human nature is finite and limited. Attempts to engineer a man-made utopia are fraught with pitfalls. Paleoconservatives prefer tradition, family, classical learning, and religious institutions to provide guidance. They tend to believe that we have lost touch with our Western heritage and indeed may be in danger of losing our civilization.2
Neoconservatism
The Neoconservatism movement originated in the 1960s with Democrats who were disillusioned with the party's foreign and domestic policies. Since that time, Noconservative ideology has continued to influence American foreign policy. Neoconservatives typically advocate for promotion of democracy and of American interests in international affairs, including by use of military force. Neocons disdain communism and political radicalism. They do, however, endorse some social welfare programs that are rejected by Paleoconservatives.3
In a 2004 article, Michael Lind wrote:
Former Nebraska Republican U.S. senator and Secretary of Defense, Chuck Hagel, was critical of the Bush administration's adoption of neoconservative ideology. He wrote in his book America: Our Next Chapter:
Comparison
Paleoconservatives tend to be traditionalist, isolationist, and America first. Their socially conservative ideology is rooted in fundamentalist Protestantism. They generally oppose social legislation and welfare programs.
Neoconservatives support an engaged and activist foreign policy. They believe in American exceptionalism, and are concerned about the "clash of civilizations" implicit in threats such Communism and Islam. They are less motivated by religion than Paleoconservatives.4
Paleoconservatives and Neoconservatives disagree on issues including immigration, foreign wars, and Middle East policy. Neocons espouse strong support for Israel and believe that America should help ensure the security of the Jewish state.5 Paleo historian Thomas Woods elaborated:
From the article 3 Basic Differences Between Conservatism and Neoconservatism:
- Neoconservatives believe the GOP should be converted to embrace a "modern democracy," aka a welfare state in the mold of FDR and the Great Society. Neoconservatives don't want to disassemble the federal government in order to rebalance divided powers between federal, state, and local governments; they just think they can pilot Leviathan better than the Democrats.
- Neoconservatives are largely secular intellectuals who ally with Bible-based people out of cynical pragmatism, not a genuine, shared love for the God of Israel.
- Neoconservatives naively think they can democratize the Muslim world with American military power.7
Three Dimensions of Ideology: "Conservatives View Things Along A Civilized/Barbaric Axis…", by John Derbyshire, 20 January 2013:
Conservatives view things along a civilized/barbaric axis, liberals along an oppressed/oppressor axis, and libertarians along a freedom/coercion axis. Conservatives will thus favor things that correlate well with (in particular, Western) civilization, while opposing things that correlate with poorly civilized societies or that would directly contradict salient features of civilization. Progressives, on the other hand, don't care about civilization - they care about defending the oppressed and opposing the oppressors. The "civilized" side can be the wrong side if it's taking on the role of an oppressor. And Libertarians don't see civilization or oppressors - they only want to know if someone is being coerced to do something - that's the wrong side.
References
1. Modern conservatism in different countries, Wikipedia.
2. Paleoconservatism, Wikipedia.
3. Neoconservatism, Wikipedia.
4. What's the difference between Paleo-Conservatives and Neoconservatives?, About.com.
5. Neoconservatism and paleoconservatism, Wikipedia.
6. Paleoconservatism vs. Neoconservatism, Jack Kerwick, About.com.
7. 3 Basic Differences Between Conservatism and Neoconservatism, Dave Swindle, PJ Media, December 27, 2013.
8. Paleoconservatism Vs. Neoconservatism: A Primer, Superblinky.
9. Conservatism's Hidden History, by Daniel Pipes, Philadelphia Inquirer, July 31, 2018.
Color Revolution
In the article Color Revolutions: The Most Sophisticated Means Of Warfare - Analysis, Eurasia Review, 6 January 2024, Matija Šerić explains:
Color revolutions are political term used to describe turbulent political events: mass street protests and riots in order to achieve a revolutionary change of government...
Under the guise of a democratic uprising, the removal of an unskilled government or a coup d'etat is actually being carried out.
Most often, external powers (without exception, the West) sponsor, plan, organize and implement "revolutions"...
Regime change has been an important feature of US foreign policy for decades, beginning with the overthrow of the Syrian government in 1949. Since then, it has been estimated that the CIA has overthrown or attempted to overthrow over 50 governments, although it has admitted only 7 cases...
... they all fall under the same scheme that includes the pattern of organizing a protest movement, transforming that movement into a political crowd and using the newly formed popular mass against the existing government as a means of political blackmail...
The first and basic condition is political instability in the country, which is accompanied by a crisis of the current authorities. Political instability can be created due to electoral fraud...
There is always a youth movement, revolutionary leaders are always similar, and revolutions lack content or revolutionary ideology. It is about the people suddenly rebelling against "evil dictators"...
... classical color revolutions consist of three stages. The first stage includes the creation of an "underground" movement of cells... Members are recruited with big slogans and calls to action. A network of mostly young disaffected suddenly leaves anonymity and appears on the streets of big cities in response to a certain signal. The protests want to present themselves as something spontaneous, but in fact everything was prepared earlier...
In the second stage, the goal is to discredit defense, security and law and order bodies through strikes, civil disobedience, riots and sabotage. Protesters are occupying city squares and streets... The third and final phase follows, which entails the "non-violent" overthrow of the government...
In the article America's "Color Revolution", Medium, 22 December 2019, Marisol Nostromo explains that:
For those readers who may be unfamiliar with the term "Color Revolution", it refers to what has now become the standard technique for promoting "regime change" in targeted nations....
Color Revolutions are expensive ($5 billion in the case of Ukraine) and are typically orchestrated by a public-private partnership comprised of government agencies such as the State Department and MI6 and/or CIA, combined with private funding and Non-Governmental Organizations (NGOs).
The most famous organization of this sort is the National Endowment For Democracy, a curious entity that is funded by the US Government through USAID (as well as by donations from major neocon private foundations), and has two sub-organizations that disseminate the funds to various Regime Change projects: the International Republican Institute, affiliated with the Republican Party, and the National Democratic Institute for International Affairs, affiliated with the Democrats. Both organizations carry out the same activity, which underscores the fact that on matters of subverting and bullying the rest of the world, there is a lot more bipartisanship in the US than people are inclined to think.
Another name associated with funding and orchestration is George Soros, whose various tax-exempt organizations such as the Open Society Foundations invariably pump money into the latest Color Revolutions...
Presidents George W. Bush and Barack Obama embraced the neocon ethos and gave them virtual carte blanche to carry out Color Revolutions around the world. ...
But it was inevitable that these techniques would eventually be used on the US itself. Donald Trump campaigned on a platform of reducing US reliance on Regime Change wars and NATO "out-of-area deployments" as a centerpiece of foreign policy. This was anathema to the neocons. ...
The standard methodology was put into play the moment Trump was inaugurated. ...
No one in their right mind believed that the confused and incoherent Biden could defeat the also incoherent, but clever and confident Trump....
Violent groups from the Antifa milieiu, predominately white and possibly assets of the FBI's COINTELPRO progam, initiated vandalism and looting. Neocons were salivating at the prospect of Maidan-style chaos....
The good news is that the neocons are not omnipotent. They are adept at conning the public and they have the full cooperation of the corporate media, but the public is volatile and increasingly skeptical of the official "narratives." ...
Lincoln A. Mitchell explains in the book The Color Revolutions:
From late 2003 through mid-2005, a series of peaceful street protests toppled corrupt and undemocratic regimes in Georgia, Ukraine, and Kyrgyzstan and ushered in the election of new presidents in all three nations. These movements—collectively known as the Color Revolutions—were greeted in the West as democratic breakthroughs that might thoroughly reshape the political terrain of the former Soviet Union....
The Color Revolutions explores the causes and consequences of all three Color Revolutions—the Rose Revolution in Georgia, the Orange Revolution in Ukraine, and the Tulip Revolution in Kyrgyzstan—identifying both common themes and national variations. Mitchell's analysis also addresses the role of American democracy promotion programs, the responses of nondemocratic regimes to the Color Revolutions, the impact of these events on U.S.-Russian relations, and the failed "revolutions" in Azerbaijan and Belarus in 2005 and 2006....
From Russia and the "Color Revolution" - A Russian Military View of a World Destabilized by the US and the West, by Anthony H. Cordesman, 28 May 2014:
... the "Color Revolution." Russian analysts have used this term since the "Rose Revolution" in Georgia in 2012, in discussing the "Orange Revolution" in Ukraine in 2004, and the "Tulip Revolution" that took place in Kyrgyzstan in 2005.
Russian military officers now tied the term "Color Revolution" to the crisis in Ukraine and to what they saw as a new US and European approach to warfare that focuses on creating destabilizing revolutions in other states as a means of serving their security interests at low cost and with minimal casualties. It was seen as posing a potential threat to Russian in the near abroad, to China and Asia states not aligned with the US, and as a means of destabilizing states in the Middle East, Africa, Central Asia, and South Asia....
Russia and the "Color Revolution" - A Russian Military View of a World Destabilized by the US and the West, KEY BRIEFS, and is available on the Burke Chair web site...
Left-leaning Wikipedia has a catalog and map of Color Revolutions.
From Explaining the Color Revolutions, by Poh Phaik Thien, E-International Relations, 31July 2009:
Scholars witnessed a ‘bulldozer revolution' in Serbia in 2000, a ‘rose revolution' in Georgia in 2003, an ‘orange revolution' in Ukraine in December 2004 and then a ‘tulip' revolution in Kyrgyzstan in early 2005. Besides these four revolutions, such political upheavals also impacted other post-Soviet countries with related and connected anti-regime's reactions and movements. Although only the Orange color revolutions actually had a color as it symbolize this term, ‘color revolution' has become a popular term for referring to the four revolutions that occurred among regional specialist and local politicians....
The United States President George W.Bush has been trying to transplant the model of color revolution in post-Soviet countries to transform Iraq, as he used the term ‘Purple Revolution' to describe the coming of democracy to Iraq...
... there are four criteria which must be satisfied. Firstly, their incumbent leader of the regimes must be very unpopular and face the so-called ‘lame-duck syndrome'. Secondly, the anti-regimes forces are enforced by mass-media and foreign influences. Thirdly, the revolution must not be ideological; it must be for the sake of better national integration, freedom, democracy and economic development. Most importantly, the demand for such improvement should be massive among the population. Lastly, the anti-regime forces should also be motivated by the grievances on the corrupted government which is supported by a foreign state which the people do not desire.
Why the Color Revolutions Failed - Toppling dictators isn't enough. Successful revolutions also embrace the rule of law. By Melinda Haring, Michael Cecire, Foreign Policy, 18 March 18 2013:
Why did they fail? Quite simply, the rule of law never took root. Too often, the color revolution governments acted above or with little regard to the democratic legal standard to which they held their predecessors....
An in-depth analysis of The Color Revolution Model: An Exposé of the Core Mechanics, by Andrew Korybko, Center for Syncretic Studies, 3 December 2015:
... A Color Revolution is a complex interplay of many parts operating simultaneously. The Movement has to properly build its six Infrastructures prior to the onset of the public destabilization, and it needs an Event to galvanize its support and justify its actions to the targeted audiences. The Physical Infrastructures assist the Movement in gaining traction and attention, and they make the Color Revolution appear popular and spontaneous...
Conservative, Liberal, or both?
In the article Top Five Reasons Not to Vote, Doug Casey notes in a Libertarian missive that "voting encourages politicians". Actually, the opposite is more accurate - that if you don't vote you encourage politicians. In other words, voting is the primary constraint that sovereign Americans can impose on their elected public servants. As in "vote the bums out!"
But who do you vote for as a candidate? Are you a liberal (left) or a conservative (right)? Where do the candidates fall along the liberal - conservative line?
Casey points out that the single liberal conservative dimension is particularly constraining. Not only do these abstract terms change with every politician, they change over time. He notes that:
In the 19th century, a liberal was someone who believed in free speech, social mobility, limited government, and strict property rights. The term has since been appropriated by those who, although sometimes still believing in limited free speech, always support strong government and weak property rights, and who see everyone as a member of a class or group.
Conservatives have always tended to believe in strong government and nationalism... Today's conservatives are sometimes seen as defenders of economic liberty and free markets, although that is mostly true only when those concepts are perceived to coincide with the interests of big business and economic nationalism.
Bracketing political beliefs on an illogical scale, running only from left to right, results in constrained thinking...
Politics is the theory and practice of government. It concerns itself with how force should be applied in controlling people, which is to say, in restricting their freedom. It should be analyzed on that basis...
Casey delineates two fundamental types of freedom: social and economic. He then suggests that the political spectrum can be more accurately portrayed in a two-dimensional chart representing both social and economic freedom.

Thus, for example, a person or a candidate may lean toward personal freedom but not economic freedom - in other words, the government should not interfere with personal lifestyle choices, but it should direct the economy. Or a person or candidate may favor the opposite, or may fall anywhere within the chart.
The Nolan Chart
Casey's chart is a derivative of the Nolan Chart, which is a political view assessment diagram created by David Nolan in 1969. The chart represents political opinion along two axes: economic and personal. It presents political views according to degrees of economic and personal freedom. Nolan stated that when someone views this chart, it causes an irreversible change: viewers subsequently view the political orientations in two dimensions instead of one.
Economic freedom relates to what people do as producers and consumers and what they do with their money. For example: where they work, ability to start a business, and ability to buy a home. Personal freedom relates to self-expression, and what people do with their minds and bodies. For example: recreational activities, membership in organizations, and drugs and foods they consume.
Most government control and involvement falls within these two arenas of economics and personal activity. Wikipedia notes that:
The extremes are no government at all in either area (anarchism) or total or near-total government control of everything (various forms of totalitarianism). Most political philosophies fall somewhere in between. In broad terms:
• Conservatives and those on the right tend to favor more freedom in economic areas (example: a free market), but more government intervention in personal matters (example: drug laws).
• Liberals and those on the left (by the common US meanings of those terms) tend to favor more freedom in personal areas (example: no military draft), but more government activism or control in economics (example: a government-mandated minimum wage).
• Libertarians favor both personal and economic freedom, and oppose most (or all) government intervention in both areas. Like conservatives, libertarians believe that people should be free to make economic choices for themselves. Like liberals, libertarians believe in personal freedom.
• Statists favor a lot of government control in both the personal and economic areas. Different versions of the chart, as well as Nolan's original chart, use terms such as "communitarian" or "populist" to label this corner of the chart.
Here's another version of the Nolan Chart which uses traditional left (red) versus conservative (blue) coloration:
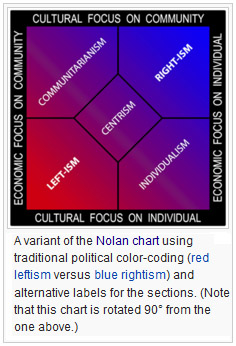
(The above two charts courtesy Wikipedia).
Additional dimensions
Of course, there exist political categories or dimensions other than personal and economic. For example, the environmental dimension extends along an axis from:
nature is there for man's taking (anthropocentrism)
balancing human impact with nature (environmentalism)
protecting future generations - of all species (deep ecology)
Thus, it would be possible to be an environmentalist and a liberal (it seems that many environmentalists fall into this category). But it would also be consistent to be a deep ecologist while being fundamentally conservative (indeed, the late Middle English root of "conservative" is to conserve or preserve).
Similarly, additional dimensions might include international versus domestic priorities, free market system versus social collectivism, empire-building warfare versus peace, etc.
Where do you stand?
A number of self-administered quizzes are available for you to find out where you fit. They aren't perfect, but they are interesting to take. Here are a few:
The World's Smallest Political Quiz
Best Political Quiz - This quiz measures political positions along five axes: Overall Standing, International Affairs, Social, Environment, and Economic.
The Enhanced Precision Political Quiz...in 2D
I Side With: 2016 Presidential Election - How do your beliefs align with the potential candidates?
(When taking any quiz online, don't provide personal information that could be used for tracking purposes.)
Critical Race Theory
Critical Race Theory is related to Critical Theory, a Marxist approach oriented towards destructive criticism of the main elements of Western culture. The key to understanding Critical Race Theory and Critical Theory is their destructive agenda: criticize, dismantle, and destroy.

The following article explains the history of Critical Race Theory. Excerpts are included below, and the entire article is well worth reading.
Critical Race Theory: What It Is and How to Fight It, by Christopher F. Rufo, Imprimis, Hillsdale College, March 2021:
... Originally, the Marxist Left built its political program on the theory of class conflict. Marx believed that the primary characteristic of industrial societies was the imbalance of power between capitalists and workers. The solution to that imbalance, according to Marx, was revolution... and usher in a new socialist society.
During the 20th century, a number of regimes underwent Marxist-style revolutions, and each ended in disaster. Socialist governments in the Soviet Union, China, Cambodia, Cuba, and elsewhere racked up a body count of nearly 100 million of their own people... In practice, Marx’s ideas unleashed man’s darkest brutalities.
By the mid-1960s, Marxist intellectuals... came to realize that workers’ revolutions would never occur in Western Europe or the United States, where there were large middle classes and rapidly improving standards of living...
Abandoning Marx’s economic dialectic of capitalists and workers, they substituted race for class and sought to create a revolutionary coalition of the dispossessed based on racial and ethnic categories...
Critical race theory is an academic discipline, formulated in the 1990s, built on the intellectual framework of identity-based Marxism...
There are a series of euphemisms deployed by its supporters to describe critical race theory, including “equity,” “social justice,” “diversity and inclusion,” and “culturally responsive teaching.” Critical race theorists, masters of language construction, realize that “neo-Marxism” would be a hard sell. Equity, on the other hand, sounds non-threatening and is easily confused with the American principle of equality..
The editors of The American Mind oppose the spread of this pernicious ideology, stating:
As Americans concerned for the common good of the nation, we reject the following tenets of “Critical Race Theory” as directly opposed to the fundamental principles of American government and political order:
• That any human being simply by virtue of being born in a given racial category (e.g., their “whiteness”) is inherently evil or bears guilt for actions committed by others in the past or present.
• That the principle of the inherent equality and dignity of all human beings insofar as they are human enables racism instead of serving as the firmest bulwark against it.
• That those who oppose replacing the equality of all citizens under the law with a system of “equity” that treats people unequally based on racial categories are complicit in racism or white supremacy.
• That establishing a legal regime of racial hierarchies is equitable or just.
Art Keller writes that sociologist Bradley Campbell, author of The Rise of Victimhood Culture, explains:
In my own work I’ve called it a “moral culture” rather than a religion, and I think that’s probably more accurate. We could call it “social justice culture,” or as Jason Manning and I called it, “victimhood culture,” but in any case, it’s a worldview that places a certain conception of social justice as the highest value...
Drawing from critical theory, those who embrace this moral culture tend to view various social identities as the most important thing about people, and they see those identities as oppressor or victim identities. To be white, male, Christian, or straight, for example is to have a privileged position in a system of oppression, and to be a person of color, female, non-Christian, or LGBT is to be disadvantaged...
... interpreting everything in terms of oppression and in elevating those concerns above all others seems to have led many of the activists to disregard liberal values such as due process and free speech.
Dan Proft signifies the destructive agenda of Critical Race Theory in his April 21, 2021 American Greatness article, It’s Not a Race War. It’s Something Much Bigger - Do not confuse the tactic for the strategy:
The Left wants a race war in America because they cannot otherwise win the ideological war they are waging.
The former is a cover for the latter...
Today’s Marxists’ ideological pursuit of tyrannical control transcends race, which is merely a stealth bomber in their fleet. This is not a race war. It’s something much bigger.
How to counter Critical Race Theory?
This 5 minute PragerU video describes Critical Race Theory and what you can do to stop it: What Is Critical Race Theory?, by James Lindsay.
"Refuse to accept it. Don't be intimidated by the "heads I win and tails you lose" logic of this self-destructive, America-hating, anti-reality idea. Don't be bullied into thinking that you're a racist when you know you're not. Or that you're a victim when you know you're not."
The editors of the American Mind contend that:
• Human beings are fundamentally equal insofar as they are human and citizens and must be treated as such by law.
• Blaming groups of citizens for evils they did not commit based on their race, color, or ethnicity is morally wrong and will result in civic disorder and balkanization.
• A system based on “equity”, in which equity means rejecting equality under the law and distributing goods and services on the basis of race alone is neither equitable nor just.
• Government and public institutions must not discriminate against or grant preferential treatment to persons on the basis of race, color, or ethnicity.
Those who agree with the above points and disagree with Critical Race Theory (CRT) are labeled with "unconscious bias," "white fragility," or as "white supremacists." In other words, defense of CRT amounts to a hollow tautology that attempts to intimidate and silence those who disagree with it. The invective "You're not a racist, are you?" sounds strikingly like "You don't still beat your wife, do you?"
It takes a bit of courage and stamina to stay the course against this societal delirium.
Christopher F. Rufo states:
No longer simply an academic matter, critical race theory has become a tool of political power...
Critical race theorists must be confronted with and forced to speak to the facts...
There are three parts to a successful strategy to defeat the forces of critical race theory: governmental action, grassroots mobilization, and an appeal to principle.
Similarly, in addition to pointing out the dishonesty of the historical narrative on which critical race theory is predicated, we must promote the true story of America...
Critical Race Theory is a Victimization Cult, by Art Keller, June 29, 2020.
Book: The Rise of Victimhood Culture: Microaggressions, Safe Spaces, and the New Culture Wars, by Bradley Campbell, 2018.
Book: Political Correctness: A Short History of an Ideology, Edited by William Lind, November 2004. Read the entire book (pdf).
The Truth About Critical Race Theory, Christopher F. Rufo, Wall Street Journal October 5, 2020.
Cultural Marxism, Political Correctness, and Critical Theory, CAIRCO research.
It’s Not a Race War. It’s Something Much Bigger - Do not confuse the tactic for the strategy, by Dan Proft, American Greatness, April 21, 2021
Coordination and Decomposition, by Gregory Hood, American Renaissance, April 9, 2021
Standing Against Critical Race Theory, by Christopher Rufo, American Mind, April 21, 2021.
Recommended video: Why Identity Politics Cannot Tolerate Free Speech, Center for the American Way of Life, February 24, 2021: Arthur Milikh, Director of the Center for the American Way of Life, joins Jan Jekielek on American Thought Leaders to discuss the real goal behind the criminalization of hate speech. At 4:07, Milikh discusses Critical race theory, identity politics, and hate speech laws.
A White-Out of Whites: Ignoring the Albino, Dhimmi Elephant In the Room, by Ilana Mercer, American Renaissance, May 29, 2021:
Strictly speaking, Critical Race Theory is not even traditionally racist; it’s exclusively anti-white. It is pro all races other than white....
Critical Race Theory’s central project is to make whites accept dhimmitude, not socialism....
NC Lt. Governor Mark Robinson: Critical Race Theory Mirrors Teachings Of The KKK (VIDEO), Gateway Pundit, June 1, 2021:
Five tips for debating Critical Race Theory, by Joseph E. McIsaac, American Thinker, June 16, 2021.
Frederick Douglass Versus the 1619 Project - Critical Race Theory's big lie about American history, by Dinesh D'Souza, Frontpage Mag, July 16, 2021:
... Brockell recalls Douglass’s famous July 4 address (pdf), delivered in Rochester, New York, to the Rochester Ladies’ Anti-Slavery Society. The first part of the speech does indeed support Brockell’s account, because Douglass gives a savage indictment of how American independence looks to a black man...
Already one can see Douglass’s speech as a masterpiece of rhetoric, each phrase building on the previous one, almost like a wave gathering force before crashing down on the audience. Yet as the speech moves on, Douglass makes a sharp and surprising turn. Far from denouncing the Fourth of July, far from scorning the Declaration of Independence as a charter of hypocrisy, far from blaming the Constitution for making an unholy pact with slavery—this is precisely what the critical race theorists do today—Douglass roundly affirms the founding as a “glorious liberty document” that launched “forces in operation” that “must inevitably work the downfall of slavery.”...
Douglass ended his speech on a patriotic note that vividly contrasts with the way he began, and shows why he had no problem, in the end, with celebrating the Fourth of July and what it represented. Of the Constitution, Douglass later said, “Abolish slavery tomorrow, and not a sentence or syllable of the Constitution needs to be altered.” That’s because the document gives no support, no sanction, to slavery....
Cynical Minds - a review of the book Cynical Theories, by Fred Elbel, June 21, 2021.
Cultural Marxism, Political Correctness, and Critical Theory
Political Correctness is a deadly serious form of Cultural Marxism, which views culture as the basis of class struggle. Cultural Marxism relies on deconstruction to undermine underlying cultural values in order to pave the way to fundamentally transform a society. Critical Theory in essence means criticizing society in order to expose weaknesses and facilitate change.
An informative synopsis of Political Correctness / Cultural Marxism, by Discover the Networks1 is included below (adapted from Lind's Political Correctness: A Short History of an Ideology).2
America today is dominated by a system of beliefs, attitudes and values that we have come to know as "Political Correctness." For many it is an annoyance and a self parodying joke. But Political Correctness is deadly serious in its aims, seeking to impose a uniformity of thought and behavior on all Americans. It is therefore totalitarian in nature. Its roots lie in a version of Marxism which sees culture, rather than the economy, as the site of class struggle.
Under Marxist economic theory, the oppressed workers were supposed to be the beneficiaries of a social revolution that would place them on top of the power structure. When these revolutionary opportunities presented themselves, however, the workers did not respond. The Marxist revolutionaries did not blame their theory for these failures; instead they blamed the "ruling class," which had bought off the workers by giving them "rights," and had blinded them with a "false consciousness" that led them to support national governments and liberal democracy.
One group of Marxist intellectuals resolved this apparent contradiction of Marxist theory by an analysis that focused on society's cultural "superstructure" rather than on the economic "base" as Marx did. The Italian Marxist Antonio Gramsci and Hungarian Marxist Georg Lukacs contributed the most to this new cultural Marxism.
Among Marxists, Gramsci is noted for his theory that cultural hegemony is the means to class dominance. In his view, a new "Communist man" had to be created through a changed culture before any political revolution was possible. This led to a focus on the efforts of intellectuals in the fields of education and media.
Georg Lukacs believed that for a new Marxist culture to emerge, the existing culture must be destroyed. He said, "I saw the revolutionary destruction of society as the one and only solution to the cultural contradictions of the epoch.... Such a worldwide overturning of values cannot take place without the annihilation of the old values and the creation of new ones by the revolutionaries."
In 1923, Lukacs and other Marxist intellectuals associated with the Communist Party of Germany founded the Institute of Social Research at Frankfurt University in Frankfurt, Germany. The Institute, which became known as the Frankfurt School, was modeled after the Marx-Engels Institute in Moscow. In 1933, when Nazis came to power in Germany, the members of the Frankfurt School fled. Most came to the United States and many became influential in American universities. The Frankfurt School's studies combined Marxist analysis with Freudian psychoanalysis to form the basis of what became known as "Critical Theory."
Critical Theory was essentially destructive criticism of the main elements of Western culture, including Christianity, capitalism, authority, the family, patriarchy, hierarchy, morality, tradition, sexual restraint, loyalty, patriotism, nationalism, heredity, ethnocentrism, convention and conservatism.
Critical Theorists recognized that traditional beliefs and the existing social structure would have to be destroyed and then replaced with a "new thinking" that would become as much a part of elementary consciousness as the old one had been. Their theories took hold in the tumultuous 1960s, when the Vietnam War opened a Pandora's Box of reevaluaton and revolution. The student radicals of the era were strongly influenced by revolutionary ideas, among them those of Herbert Marcuse, a member of the Frankfurt School who preach the "Great Refusal," a rejection of all basic Western concepts and an embrace of sexual liberation, and the merits of feminist and black revolutions. His primary thesis was that university students, ghetto blacks, the alienated, the asocial, and the Third World could take the place of the proletariat in the coming Communist revolution.
Marcuse may be the most important member of the Frankfurt School in terms of the origins of Political Correctness, because he was the critical link to the counterculture of the 1960s. His objective was clear: "One can rightfully speak of a cultural revolution, since the protest is directed toward the whole cultural establishment, including morality of existing society."
When addressing the general public, contemporary advocates of Political Correctness - or Cultural Marxism, as it might just as easily be called - present their beliefs with appealing simplicity as merely a commitment to being "sensitive" to other people and embracing values such as "tolerance" and "diversity."
The reality is different. Political Correctness is the use of culture as a sharp weapon to enforce new norms and to stigmatize those who dissent from the new dispensation; to stigmatize those who insist on values that will impede the new "PC" regime: free speech and free and objective intellectual inquiry.
Adapted from: "Political Correctness": A Short History of an Ideology," edited by William Lind (November 2004).2
Deconstruction
Author William Lind describes in the article The Origins of Political Correctness how the agenda of Cultural Marxism is implicitly deconstructionist:3
...We have it primarily on college campuses, but it is spreading throughout the whole society. Were does it come from? What is it?
We call it "Political Correctness." The name originated as something of a joke, literally in a comic strip, and we tend still to think of it as only half-serious. In fact, it's deadly serious. It is the great disease of our century, the disease that has left tens of millions of people dead in Europe, in Russia, in China, indeed around the world. It is the disease of ideology. PC is not funny. PC is deadly serious.
If we look at it analytically, if we look at it historically, we quickly find out exactly what it is. Political Correctness is cultural Marxism. It is Marxism translated from economic into cultural terms. It is an effort that goes back not to the 1960s and the hippies and the peace movement, but back to World War I. If we compare the basic tenets of Political Correctness with classical Marxism the parallels are very obvious.
First of all, both are totalitarian ideologies...
... the cultural Marxism of Political Correctness, like economic Marxism, has a single factor explanation of history. Economic Marxism says that all of history is determined by ownership of means of production. Cultural Marxism, or Political Correctness, says that all history is determined by power, by which groups defined in terms of race, sex, etc., have power over which other groups. Nothing else matters. All literature, indeed, is about that. Everything in the past is about that one thing.
... just as in classical economic Marxism certain groups, i.e. workers and peasants, are a priori good, and other groups, i.e., the bourgeoisie and capital owners, are evil. In the cultural Marxism of Political Correctness certain groups are good - feminist women, (only feminist women, non-feminist women are deemed not to exist) blacks, Hispanics, homosexuals. These groups are determined to be "victims," and therefore automatically good regardless of what any of them do. Similarly, white males are determined automatically to be evil, thereby becoming the equivalent of the bourgeoisie in economic Marxism.
... both economic and cultural Marxism rely on expropriation. When the classical Marxists, the communists, took over a country like Russia, they expropriated the bourgeoisie, they took away their property. Similarly, when the cultural Marxists take over a university campus, they expropriate through things like quotas for admissions...
For the cultural Marxist, it's deconstruction. Deconstruction essentially takes any text, removes all meaning from it and re-inserts any meaning desired... So the parallels are very evident between the classical Marxism that we're familiar with in the old Soviet Union and the cultural Marxism that we see today as Political Correctness...
History
Chuck Rogér summarizes Cultural Marxist history:4
Gramsci's cultural Marxism began to reach throughout society when Frankfurt University's Institute for Marxism -- renamed the Institute for Social Research and informally called the Frankfurt School - fled Nazi Germany, took up temporary residence at Columbia University in 1933, and then, during World War II, began using Gramsci-derived "critical theory" to "deconstruct" American society. German-born philosopher-writer Herbert Marcuse and other Marxists carried cultural Marxism beyond Columbia, and progressives adopted the disease as a weapon of "change" to be deployed within the education system...
So camouflaged has been the use of Gramsci's brainchild that most education school indoctrinees -- K-12 teachers -- have never really weighed the consequences of conditioning students to reject a moral and prosperous America...
Critical Theory
An integral component of Cultural Marxism is Critical Theory. Lind describes it as:2,3
Critical Theory was essentially destructive criticism of the main elements of Western culture, including Christianity, capitalism, authority, the family, patriarchy, hierarchy, morality, tradition, sexual restraint, loyalty, patriotism, nationalism, heredity, ethnocentrism, convention and conservatism.
Critical Theorists recognized that traditional beliefs and the existing social structure would have to be destroyed and then replaced with a "new thinking" that would become as much a part of elementary consciousness as the old one had been...
... the radical feminism, the women's studies departments, the gay studies departments, the black studies departments - all these things are branches of Critical Theory. What the Frankfurt School essentially does is draw on both Marx and Freud in the 1930s to create this theory called Critical Theory. The term is ingenious because you're tempted to ask, "What is the theory?" The theory is to criticize. The theory is that the way to bring down Western culture and the capitalist order is not to lay down an alternative. They explicitly refuse to do that. They say it can't be done, that we can't imagine what a free society would look like (their definition of a free society). As long as we're living under repression - the repression of a capitalistic economic order which creates (in their theory) the Freudian condition, the conditions that Freud describes in individuals of repression - we can't even imagine it.
What Critical Theory is about is simply criticizing. It calls for the most destructive criticism possible, in every possible way, designed to bring the current order down. And, of course, when we hear from the feminists that the whole of society is just out to get women and so on, that kind of criticism is a derivative of Critical Theory. It is all coming from the 1930s, not the 1960s...
Critical Theory is used by leftist deconstructionists to reframe the political debate from discourse about good and bad ideas to good and bad people. The far left believes that their battle is not about political ideas, but about bad people - that is, the Republicans - who should be taken out via every means possible, including violence.
For a succinct discussion of Critical Theory concepts, see Critical Theory by New Discoveries.
Also see: A Beginner's Curriculum on Critical Race Theory, by Helen Pluckrose and James Lindsay, New Discoveries, June 23, 2020.
Multiculturalism
Linda Kimball points out that multiculturalism is but another facet of Cultural Marxism:5
The blogger Fjordman notes that:6
Not only has Marxism survived, it is thriving and has in some ways grown stronger. Leftist ideas about Multiculturalism and de-facto open borders have achieved a virtual hegemony in public discourse, their critics vilified and demonized. By hiding their intentions under labels such as "anti-racism" and "tolerance," Leftists have achieved a degree of censorship of public discourse they could never have dreamt of had they openly stated that their intention was to radically transform Western civilization and destroy its foundations.
The Left have become ideological orphans after the Cold War, or perhaps we should call them ideological mercenaries. Although the viable economic alternative to capitalism didn't work out, their hatred for this system never subsided, it merely transformed into other forms. Multiculturalism is just a different word for "divide and conquer," pitting various ethnic and cultural groups against each other and destroying the coherence of Western society from within.
At the very least, the people living in the former Communist countries knew and admitted that they were taking part in a gigantic social experiment, and that the media and the authorities were serving them propaganda to shore up support for this project. Yet in the supposedly free West, we are taking part in a gigantic social experiment of Multiculturalism and Muslim immigration every bit as radical, utopian and potentially dangerous as Communism, seeking to transform our entire society from top to bottom, and still we refuse to even acknowledge that this is going on.
Video
The Best 30-Minute Explanation of Marxism and its current manifestation of "equity" and "wokeness".
Here are a few excerpts from the video:
The definition of equity comes from the public administration literature. It was written by a man named George Frederickson and the definition is an administered political economy in which shares are adjusted so that citizens are made equal. Does that sound like anything you've heard of before - like socialism?
They're going to administer an economy to make shares equal. The only difference between equity and socialism is the type of property that they redistribute: the type of shares. They're going to redistribute social and cultural capital in addition to economic and material capital.
And so this is my thesis. When we say "what is woke?" - it's Maoism with American characteristics...
We think that Marx was talking about economics...
If we go below the surface what Marx was talking about was something different.
At the end of history mankind will remember that he is a social being and we will have a socialist society - a perfect communism that transcends private property - is how he put it...
But Marx was never an economist. He was a theologian.
He wanted to produce a religion for mankind that would supersede all of the religions of mankind and bring him back to his true social nature...
We look at this idea a special form of property that segregates society into people who have - the Bourgeois - and the people who do not have - who are in class conflict...
Take out class, put in race. Change out class put in race and watch: we get Critical Race Theory...
Just Like Karl Marx said that in the Communist Manifesto he wrote communism can be summarized in a single sentence - the abolition of private property - well this is why Critical Race Theory calls to abolish Whiteness. Because whiteness is a form of private property. People who have access to this property are Whites or White adjacent or they act White...
If you think of whiteness as a form of cultural capital, white supremacy as they define it is identical to capitalism... It's not believing that white people are superior. It's believing that white people have access to the control of society...
Marx merely believed it was through economic means. Now it's through socio-cultural means. The evolution into this - sometimes called Western Marxism - began in the 1920s.
5 Minute video: Understanding Marxism: From Each According to His Ability, PragerU.
5 Minute video: Understanding Marxism: Change the World, PragerU.
References
1. Political Correctness / Cultural Marxism, Discover the Networks.
2. Political Correctness: A Short History of an Ideology, Edited by William Lind, November 2004. Read the entire book (pdf).
3. The Origins of Political Correctness, by William Lind, Accuracy in Academia, February 5, 2000.
4. Cultural Marxism in Education: The Gathering Revolt, by Chuck Roger, American Thinker, April 18, 2010.
5. Cultural Marxism, by Linda Kimball, American Thinker, February 15, 2007.
6. Political Correctness: The Revenge of Marxism, by Fjordam, Gates of Vienna, June 14, 2006.
7. Who Stole Our Culture?, by William Lind, World Net Daily, May 24, 2007.
8. Why There Is A Culture War: Gramsci and Tocqueville in America
9. What Is the Frankfurt School (And Its Effect on America)?, by Dr. Gerald L. Atkinson, Western Voices World News, August 1, 1999.
10. Multiculturalism and Marxism, by Frank Ellis, Discover the Networks, November, 1999.
11. A Guide for the Perplexed: A Brief History of Political Correctness and Its Origins, by Cartes A. Jouer, Pamela Geller - Atlas Shrugged, September 3, 2012.
12. What is Cultural Marxism?, Destroy Cultural Marxism, January 8, 2013.
13. A Progressive's Guide to Political Correctness, Washington Post Pulitzer Prize-winning columnist George Will:
14. What Is Cultural Marxism?, Katehon:
...In brief, a Cultural Marxist is one who believes that that cultural/civilizational factors are irrelevant in understanding any type of social, political, or international form of relations, and in order to advance their "cultural-blind" end goal ideology, they:
(1) first support the dilution and then abolishment of majority cultures via the 'politically correct' dominance of minority/immigrant cultures, typically using slurring accusations of "racism", "fascism", and "white supremacy" to attack those who oppose this radical platform;
(2) and then afterwards 'smoothing over' all the remaining cultural mass into an amorpheous and unoriginal 'blob' which loses all aspects of its former cultural identity and is thenceforth molded into a new and unprecedented form of being.
Stage one is in process all throughout the EU and parts of the US...
15. The Democrats' Second Secession & America's New Civil War - How to look at the bizarre turn our political life has taken, by David Horowitz, FrontPage Mag, May 26, 2017.
16. A Long History of Leftist Hatred, by Pat Buchanan, American Renaissance, June 16, 2017.
17. How leftist philosophy fuels political violence, by Nate Madden, Conservative Review, June 16, 2017.
18. Leftists versus the People, by Jeffrey Folks, American Thinker, February 24, 2018. Do they really hate ordinary people that much?
19. A Beginner's Curriculum on Critical Race Theory, by Helen Pluckrose and James Lindsay, New Discoveries, June 23, 2020.
20. Critical Race Theory's Destructive Impact on America, by Carol M. Swain, 1776 Unites, July, 2020.
21. Critical Race Theory is a Victimization Cult, by Art Keller, New Discourses, June 29, 2020.
22. The Challenge of Marxism, by Yoram Hazony, Quillette, August 16, 2020. Review: The Marxist threat to liberalism, by Fred Elbel, August 24, 2020.
23. Videos: Towards a Better Understanding of the Left. Are you struggling to understand the cultural revolution being foisted on the American People? While much has been written on Cultural Marxism and Progressivism, the spoken work offers another path to understanding the fundamentals.
Democracy or a Republic?
Recent statements by our ruling elites - that is, the Democrat party - express purported concern for "preserving our democracy." For example:
"...democracy was attacked" - remarks By president Biden To Mark One Year Since The January 6th Deadly Assault On The U.S. Capitol.
"...our democracy came under assault" - remarks by Vice President Harris Marking One Year Since the January 6th Deadly Assault on the U.S. Capitol.
"... be part of saving our democracy?" - press Briefing by Press Secretary Jen Psaki, January 6, 2022.
What the ruling elites really mean when they say they want to "preserve our democracy" is they want to "preserve their Oligarchy."
There are two problems with that:
1. The United States of America is a Constitutional Republic, not a democracy.
2. It's not their democracy to preserve. The beauty of a Constitutional Republic is that power lies with the sovereign American people, in a Republican form of representation.
The United States is a Constitutional Republic
These United States are a Constitutional Republic, not a Democracy. In a Democracy, power is lodged in the hands of the majority. As has been said, a democracy is two wolves and a sheep deciding on what's for dinner.
Judge Napolitano, a Constitutional Attorney, has pointed out that in a Democracy the majority can vote to take your property - and your freedom - if they so desire. This is in essence mob rule, which has always resulted in eventual anarchy and collapse - usually into totalitarianism.
Plato summed it up:
Democracy leads to anarchy, which is mob rule." - Plato (429-347 BC)
The Founding Fathers did not want a Democracy. James Madison stated in the Federalist Papers:
"Hence it is that such democracies have ever been spectacles of turbulence and contention: have ever been found incompatible with personal
He stated in Federalist No. 10:
"A pure democracy, by which I mean a society consisting of a small number of citizens, who assemble and administer the government in person, can admit of no cure for the mischiefs of faction,"
Thus the term "democracy" does not appear in the U.S. Constitution. The term "republic" does. And as everyone knows, we pledge allegiance to the Republic, not to the democracy.
Excerpt from "A Republic, Not A Democracy" by Dan Smoot, Apr 18, 1966
"A constitutional republic not a democracy. The ideal of a democracy is universal equality. The ideal of a constitutional republic is individual liberty. A democracy always degenerates into dictatorship, which promises government guaranteed equality and security, but it delivers nothing but poverty and serfdom for the people it robs and rules. America was founded as a constitutional republic to safeguard the liberties of the people against the tyranny of democracy or of one man dictatorship. In this century, great strides have been made toward the goal of subverting our Republic into a democracy. The foremost tactic of the subverters is subversion of language by calling America a democracy, until people thoughtlessly accept and use the term, the totalitarians have obscured the real meaning of our principles of government."
Quick references:
Constitution: The U.S. Is Not A Democracy, Roma Cox, 20 February 2011.
Is the United States a Republic? - The United States of America is defined as a constitutional republic, ConstitutionUS.
Countries Considered to be Full Democracies
Here are Countries Considered to be Full Democracies, from World Atlas. Norway is the world’s leading democratic nation, with a score of 10. The score is an implication that all the democratic principles in this country are upheld. Note that the United States is not on this list.
Rank Country Score
1 Norway 10
2 Iceland 9.58
3 Sweden 9.39
4 New Zealand 9.26
5 Denmark 9.22
6 Ireland 9.15
7 Canada 9.15
8 Australia 9.09
9 Finland 9.03
10 Switzerland 9.03
11 Netherlands 8.89
12 Luxembourg 8.81
13 Germany 8.61
14 United Kingdom 8.53
15 Austria 8.42
16 Mauritius 8.22
17 Malta 8.15
18 Uruguay 8.12
19 Spain 8.08
Reseach by ML.
Democracy vs "Our Democracy" by Jeremy Carl, American Mind, 26 August 2022.
‘Our Democracy’ = Their Oligarchy, by Rob Natelson, Epoch Times, 7 January 2022.
Is 'Our Democracy' Failing Our Country? by Patrick J. Buchanan, 9 October 2022.
"A republic, if you can keep it." - Benjamin Franklin
Fascism - a phenomenon of the left
Today it's commonplace for leftist liberals to call conservatives fascists. But the reality is that fascism derives from traditional liberalism. Fascism is a liberal / progressive concept, and has nothing to do with "right-wing" conservatism.
Modern liberalism derived from twentieth-century progressivism, and shared commonality with European fascism, where it was expressed as militant nationalism with blatant racist overtones.
Before World War II, fascism was viewed as a positive, progressive social movement in both America and Europe. Then the Holocaust completely changed our view of fascism to that of evil nationalism and genocidal racism.
Under FDR's presidency the term "liberalism" came to replace "progressivism" to describe center-left politics. In order to purport that the totalitarian New Deal was the opposite of fascism, liberals then created a straw man out of the conservative movement. The term "right-wing" had already been used to describe a position opposed to Roosevelt, so it was a relatively small incremental step to associate the American right with despised Nazi fascism.
Today's liberalism embodies a soft, yet still totalitarian, form of fascism. Fascism in the United States is expressed in the milder form of progressivism - as a softer form of totalitarianism more in alignment with American culture. We see in the U.S. a form of liberal fascism manifested as an ever-expanding deep state.
Fascism is a Big Government ideology, and is decidedly on the left side of the political spectrum
'Fascist' Smear Reveals Harris' Lack of Historical Knowledge, by George J. Marlin, Newsmax, 29 October 2024:
... The architects of Fascist ideology borrowed from Friedrich Hegel (1770-1831), the concept that the state was the supreme manifestation of God on earth.
They preached that every citizen must surrender their individualism in favor of the collective. Their slogan was "nothing for the individual, all for the state."...
Fascism’s most prominent thinkers, Giovani Gentile (1875-1944) and Giuseppe Prezzolini (1882-1982), argued that there should be no conflict between man and the state because "the maximum of liberty coincides with the maximum force of the state."...
The word "Fascist" stemmed from "fascio" or "club," which Mussolini founded for supporters of his brand of anti-Communist national socialism...
"Fascism," Mussolini declared, "conceives of the state as an absolute, in comparison with which all individuals or groups are relative only to be conceived in their relation to the state."
Fascists called for a "corporate state" whereby the government and corporate giants partnered to control the lives of middle-class and working-class folks.
They opposed laissez-faire capitalism and called for a planned economy.
They trampled individual rights in favor of the collective.
They supported empire building. And they hated religious institutions - particularly the Catholic Church - which opposed their ideology...
Notable author Dinesh D'Souza writes in his August 11, 2017 FrontPage Mag article, Big Liar - How Theodor Adorno redefined Fascism:
Fascism and Nazism are both phenomena of the left. This makes ideological sense, because at their core they represent ideologies of the centralized, all-powerful state. Moreover, fascism grew out of Marxism, and fascism's founder Benito Mussolini, was a Marxist and lifelong socialist. Hitler, too, was a socialist who headed the National Socialist Party and in fact changed the name of the German Workers Party to make it the National Socialist German Workers Party.
How, then, did progressives in America re-define fascism and Nazism as phenomena of the right? This sleight-of-hand occurred after World War II, once fascism and Nazism were discredited with the reputation of Holocaust. Then progressives recognized it was important to cover up the leftist roots of fascism and Nazism and to move them from the left-wing column into the right-wing column.
The man most responsible for the progressive redefinition of fascism is Theodor Adorno, a German Marxist intellectual and a member of the influential Institute for Social Research, otherwise known as the Frankfurt School. The Frankfurt School scholars were leftists and most of them were refugees from Nazi Germany. Some settled in Europe; others like Adorno and Herbert Marcuse came to the United States.
Adorno's influence in defining how fascism came to be understood in America cannot be underestimated...
Adorno decided to repackage fascism as a form of capitalism and moral traditionalism. In effect, they reinvented fascism as a phenomenon of the political right. In this preposterous interpretation, fascism was remade into two things that real fascists despised: free markets and support for a traditional moral order...
Here, after all, was a German Jewish scholar declaring fascism a phenomenon of the right. Clearly he was sticking fascism on conservatives who supported capitalism and affirmed religion and traditional families. This was a lie - real fascists detest those institutions and want to destroy them - but it was a politically convenient lie.
So the progressives delightedly climbed aboard the bandwagon and cheered him on, and the cheering continues...
Adorno's value to such people is that he empowers them to say, "Down with fascism! Now let's get rid of conservatism and expose those evil people on the right." And today Adorno's deception enables the left to call Trump a fascist and Republicans the modern incarnation of the Nazi Party. Only by understanding this big lie can we inoculate ourselves against it and correctly locate fascism and Nazism where they have always belonged - on the political left.
Dinesh D'Souza was politically persecuted under the Obama administration. He has published the book The Big Lie: Exposing the Nazi Roots of the American Left.
The article Outing Left Wing Fascists-Nazis, by Jim Oneill, Canada Free Press, August 16, 2017 also explains leftist fascism:
I like most of my fellow Republicans and conservatives was a victim of the progressive paradigm, embedded in all our institutions of culture, from academia to Hollywood to the media. ...the story that we had accepted, like suckers, was the idea that fascism and Nazism are inherently "right wing." - Dinesh D'Souza "The Big Lie: Exposing the Nazi Roots of the American Left"
... For some years now I have been shouting from the rooftops that the Fascists/Nazis were, are, and always will be a Left-wing phenomenon. I have called it the "Big Lie" (e.g. "Right Wing Nazis: The Big Lie"), and I am delighted to see that Dinesh D'Souza sees this outrageous falsehood in the same light - naming his most recent book "The Big Lie: Exposing the Nazi Roots of the American Left." (Unless otherwise stated all of the quotes in this article come from D'Souza's book).
I say I am "delighted" because D'Souza has a much larger megaphone than I do, and in addition has a professional resume to die for. That's why Dinesh earns the big bucks, and I don't. On a more serious note, that is also why D'Souza has been incarcerated as a political prisoner in the United States and I have not...
Let me start by defining some terms. What is a conservative? Politically speaking a conservative is, not surprisingly, someone who wishes to conserve, to save, something. Not to put too fine a point on it, that something that we wish to conserve is freedom, our individual liberty. That means that conservatives try to rein in or restrain government (for as government grows freedom shrinks).
Opposed to the conservative viewpoint is the, well, it goes under a variety of names... I'll simply call it the liberal/progressive/globalist/communist/socialist/statist, or fascist viewpoint - which is in favor of a huge, bloated, bureaucratic government that controls every aspect of our lives, to one degree or another...
Now might be a good time to bring up the question: what is fascism exactly? The Left would have us believe that either (1) fascism is a right-wing ideology, or (2) the answer is so muddled, arcane, obscure, and convoluted that no simple answer is possible. Both of the "answers" that the Left tries to palm off on us are nonsense. They are lies, big lies.
Fascism is a Big Government ideology, and as such belongs firmly on the left side of the political spectrum (on the side opposite from the restrained and reined in government, right-wing side of things)...
Do not buy into that leftist nonsense that patriotism is synonymous with fascism... Mahatma Gandhi was a nationalist, so was Nelson Mandela. Winston Churchill, who led Britain's courageous fight against the fascists and Nazis, was a patriot of the first order.
Conflating love of country with fascism is absolute rubbish. It's a sad specimen of humanity who takes no pride in where they live. Wanting to protect and cherish your home turf is not fascist...
So, who is our enemy? All those who would muzzle us, shackle us, rob us and scorn us. I think you know who I mean...
The Main Stream Media is by and large either clueless or intentionally lying 99% of the time (in case you haven't figured that out yet)...
The riot in Charlottesville was not Left against Right, as the media would have us believe. It was an internecine fight between two leftist factions. In short, it was Left against Left. I doubt that any of the people involved realize that fact, but nonetheless it is true. (I understand that there were also people there simply defending Confederate history, and/or protecting the right to free speech - I leave them out of this discussion).
The Nazi ANTIFA thugs were obviously left-wing, but what about the white supremacists, surely they were right-wing, right? Wrong.
The so-called "Neo-Nazis," or "Alt-Right" white supremacists are basically "Old Guard" leftist thugs, cast adrift by shifting leftist loyalties. Anyone who has done their due diligence researching the history of the Democratic Party (without ideological blinders on) knows that the Ku Klux Klan and the Democratic Party were thick as thieves for a century.
As Dinesh D'Souza recently said in a "Fox News" interview "These white nationalists, who really belong in the Democratic Party, are in a sense politically homeless, because if they show up at multicultural picnic they're Satan." My how the mighty have fallen. The Democratic Party now has a "black racists only" policy - whites need not apply.
Is Fascism Right or Left?, by Dinesh D'Souza, Prager U, December 4, 2017:

Victor Davis Hanson explains fascism [2:11 in the above video]:
90% of the people don't know what the word fascist means - that is, to use the government and abrogate the constitution and rule by dictatorial powers. And more importantly, to control industry and national economic policy and dictate to it.
Liberals' Fascist Inversion - How liberals have permuted the meaning of the term 'fascism', by Fred Elbel, The Social Contract, Winter, 2017: Book review of: Liberal Fascism - The Secret History of the American Left, From Mussolini to the Politics of Change, by Jonah Goldberg.
'Right-Wing Nazi': The Greatest Lie of the 20th Century, by Vlad Tepes, RAIR Foundation, 4 September 2024.
The "Fascism" Lie, by Sasha Stone, 17 August 2025.
"Antifa" - International Brownshirts and Soldiers of the European and American Left, by Collin McMahon, Gateway Pundit, June 6, 2020.
So, Who Are the Real Fascists?, by Ray DiLorenzo, Canada Free Press, November 17, 2018.
Giovanni Gentile - Fascism's Karl Marx is the man the Left doesn't want you to meet, by Dinesh D'Souza, August 20, 2017.
Giovanni Gentile and Italian Fascism, MacroHistory.
Liberalism sure isn't what it used to be, by Fred Elbel, CAIRCO, January 22, 2017.
The Political Persecution of Dinesh D'Souza, by Fred Elbel, CAIRCO, July 16, 2015.
Those Cultural Marxists sure have a way with words, by Fred Elbel, CAIRCO, April 24, 2017.
Ritual Defamation - controlling values, opinions, and beliefs, by Fred Elbel, CAIRCO, August 16, 2017.
The New Far Left Fascism, by Rachel Alexander, Townhall, August 10, 2020.
Naming the Enemy, by Fred Elbel, 10 June 2023.
Cultural Marxism and Political Correctness

Identity Politics: squabbling factions
Theodore Roosevelt observed:
Former Colorado Governor Richard D. Lamm similarly observed that It is a Blessing for an Individual to be Bilingual; It is a Curse for a Society to be Bilingual.
Yet Identity Politics fragments society more deeply than does national origin, which accedes over time to assimilation.
Identity Politics is defined by Dictionary.com as "political activity or movements based on or catering to the cultural, ethnic, gender, racial, religious, or social interests that characterize a group identity."
Rational Wiki expands on the definition:
Identity Politics as a political style that focuses on the issues relevant to various groups defined by a wide variety of shared characteristics, including, but not limited to, race, social class, religion, sex, gender, ethnicity, ideology, nationality, sexual orientation, gender expression, culture, currency, shared history, medical conditions, profession, and other of the many ways in which people differ from each other, and into which they may be classified or classify themselves.
Appeal to these shared commonalities, or disdain for similarly constituted groups seen as undesirable or aberrant, has likely been a feature of primate politics since before the emergence of Homo sapiens. It is not obvious from the broadest definition, but identity politics as usually understood under the label is a variant of Marxism, and as such it is a political style strongly associated with the hard political left.
Identity politics is distinguishable from political nationalism. A nationalist political movement asserts the unity of an ethnic identity and its entitlement to dominate a territory. Identity politics, by contrast, arises out of the universalist claims of Western democracies that embraced capitalism to at least some extent...
A universal assumption is that certain identity groups that are alleged to be historically oppressed are granted automatic moral worth and sympathy as a result. Who is chosen as the most deserving will of course depend on your perspective.
Wikia observes that: "identity politics means more than the sole recognition of social identity such as religion, ethnicity, or culture. Rather, identity politics seeks to carry this social identity forward, beyond mere self-identification, to a political framework based upon that identity..."
Identity Politics thus attempts to facilitate group empowerment by asserting group difference rather than equality. Identity Politics typically embraces real or imagined group victimhood and oppression by the dominant culture or race. Identity based groups typically strive to accentuate their differences from society rather than strive for equality within society.
Another aspect of identity politics is that it is used to obfuscate an ongoing class war. This was the case when, during the 2016 election, Hillary Clinton lambasted millions of voters as "a basket of deplorables, racist, sexist, homophobic, xenophobic, Islamaphobic - you name it". Race and gender of identity politics was used to conceal the ongoing and hugely important conflict between globalist elites and patriotic nationalists.
History of Identity Politics
A brief history of Identity Politics published by NPR, July 12, 2011, mentions the rise of La Raza (The Race) in 1970.
From Identity Politics by Vasiliki Neofotistos, Oxford Bibliographies, October 29, 2013:
Additionally, identity politics refers to tensions and struggles over the right to map and define the contours and fixed “essence” of specific groups. The phrase has become increasingly common in political anthropology since the second half of the 20th century with the emergence of a wide diversity of social movements, including the women’s movement, the African American civil rights movement, and the gay and lesbian movement, as well as nationalist and postcolonial movements. Central to the practice of identity politics are the notions of sameness and difference, and thus the anthropological study of identity politics involves the study of the politics of difference.
Rational Wiki sheds more light on the historical evolution of Identity Politics.
The current political version of American multiculturalism is described by Stanley Renshon in the February 8, 2011, Center for Immigration Studies article: Multiculturalism in the U.S.: Cultural Narcissism and the Politics of Recognition:
It is a term that gathered force in the aftermath of the 1960s when cultural narcissism and identity politics became fused into the multicultural movement. The historian Christopher Lasch brilliantly captured the first of these trends in his book The Cultural of Narcissism.
In it, he argued that the traditional American cultural of individualism and self-reliance was eroding in the face of growing self-absorption and a society that increasingly seemed to reward it. This set of developments gained momentum in the context of general demands of groups that had not been "mainstream" to become so and have society validate that new status politically and culturally. The absolute legitimacy of the demand by Americans of African descent for full political and legal rights and their public acceptance was the foundation on which other groups based their own demands for "recognition."
There followed group after group demanding public validation, social acceptance, and government policies to redress the historical wrongs – some very real, others exaggerated – that they used to press their claims.
Not America's history
America hasn't always been a multiculturalist, identity-driven nation. As Stephen Steinlight points out in his April 2004 Center for Immigration Studies article, High Noon to Midnight: Why Current Immigration Policy Dooms American Jewry,
Perhaps the chief distinction between today’s immigration and that of yesteryear is the absence of the tacit and overt pressures that assimilated even the most recalcitrant. These forces have been weakened by multiculturalist ideology that legitimizes and reinforces identity politics; the demise of Americanization programs; the death of civic education; the rise of bilingualism; and the elimination of obligatory national service.
Similarly, Peter Brimelow, author of Alien Nation, observes in his 2002 VDare article Peter Brimelow (“a once-respected conservative voice”) on Goldberg of National Review:
Contrary to the melting pot myth, America has not always been a multicultural, multiracial kaleidoscope held together by some abstract principles. At the time of the Revolution, it was completely white, overwhelmingly Protestant (98%), heavily British (80%), significantly English (60%). (There were of course black slaves, but they were not part of the political nation.) Over time, immigration did gradually alter this, but less than immigration enthusiasts think – demographers estimate that the population of the U.S. would be about half of what it is now if there had been no immigration at all after 1790. When non-traditional groups arrived, there was always intense debate which, if the inflow did not abate spontaneously (the Irish after 1850), resulted in government cut-offs (the Chinese, the Japanese, the “new immigrants” 1880-1921). And blacks were painfully integrated. But the U.S. was 90% white as late as 1960.
Jonah lovingly quotes Ramesh Ponnuru disparaging immigration reform as “identity politics for white people.” (Why can`t whites have identity politics, incidentally, if blacks and Hispanics —or Hindus or Indians— can?) But, historically, “white identity politics” would have been called simply— “American identity politics.”
You can approve of this historical fact or not. But you cannot deny it.
Leftist agenda
Identity Politics is a relatively new phenomenon in American politics which has been embraced by leftists, progressives, and the Democrat Party - particularly under the Obama administration. While initially serving to differentiate the party from conservative agendas, it is beginning to short-circuit the party's efficacy.
In a May 18, 2015 USA Today article, Democrats sic identity politics on their own - The left has handicapped its ability to debate policy, even among themselves, Glenn Harlan Reynolds observes that:
In my experience, people argue identity when they don't want to argue policy. And the reason they don't want to argue policy, usually, is that they're wrong. But in arguing that everyone who disagrees with them is a racist, or a sexist, or a tool of Big Money, or whatever, the Democrats run the risk of self-destruction. This is basically what happened to the the Labour Party in Britain: A reliance on easy tropes that please the base but alienate other voters...
Likewise, too many prominent Democrats and supporters have spent the past six years calling everyone who doesn't agree with Obama a racist...
Joe Klein expresses a similar concern in the September 10, 2012 TIME article, One for All and All for One - It's time for Democrats to move away from identity politics:
The Democrats have a serious problem. It is a problem that stems from the party's greatest strength: its long-term support for inclusion and equal rights for all, its support of racial integration and equal rights for women and homosexuals and its humane stand on immigration reform. Those heroic positions, which I celebrate, cost the Democrats more than a few elections in the past. And they caused an understandable, if misguided, overreaction within the party--a drift toward identity politics, toward special pleading. Inclusion became exclusive...
If the Democrat Party truly wants to be a party of inclusion, it must reach out to those who are currently excluded from its identity politics...
In summary
More than just a nation of squabbling nationalities, America is fast becoming a nation of squabbling identity groups vying for elevated victimhood status. In essence, identity groups are striving to dis-assimilate from mainstream culture, resulting in a fragmented society and loss of cultural cohesion in America.
Perhaps a modernized version of Roosevelt's quote should read:
Additional reading
The Social Justice Endgame - What do social justice warriors want?, by David Azerrad, Claremont Review of Books, Spring 2020. An excellent article well worth reading:
... The manifold contradictions of identity politics invite us to look beyond the misleading kumbaya rhetoric and examine its actual goals. There is one question in particular the identitarians are careful to avoid, as it goes to the heart of their project....
The Real Endgame
... The real goal of iden tity politics thus proves to be not proportional representation, but greater diversity, i.e., fewer whites, fewer men, and fewer heterosexuals. For that is all that “diversity” means: fewer members of the bad groups. How few we are never told, but fewer than we currently have is always an imperative. Beyond that, the term “diversity” is essentially meaningless....
The primacy of diversity over parity is further confirmed by the barely restrained jubilation with which the media and the Left greet news of America’s impending demographic transformation into a so-called “majority-minority” country. In 2015, at a lunch in honor of Brazilian President Dilma Rousseff, Vice President Joe Biden celebrated America’s “unrelenting stream of immigration”—specifically Muslims, Africans, Asians, and Hispanics. “It’s not gonna stop, nor should we want it to stop,” Biden enthused. “As a matter of fact, it’s one of the things, I think, we can be most proud of.” In his excitement, Biden moved up the date of the demographic tipping point by almost three decades:
"Folks like me, who are Caucasian of European descent, for the first time, in 2017, will be an absolute minority in the United States of America. Absolute minority. Fewer than 50% of the people in America from then and on will be white, European stock. That’s not a bad thing. That’s a source of our strength."
... This demographic trend line—what has been called “the browning of America”—is presented to America’s white majority as a just dispensation from above to which all must submit.... Nor should you want to do anything about it, since a less white America will be a better America... Only a racist would oppose the rapid demographic transformation of his country...
America, in other words, is defined teleologically by its future demographic composition... It belongs not to all its citizens, but to the future progeny of its nonwhite population....
The emasculation of men, the promotion of sexual perversion, and the flooding of America with non-white immigrants are necessary but not sufficient to achieve identitarian social justice. Even then, a rump of whites will still remain. And though they will have been reduced to a minority who are no longer overrepresented in all realms of accomplishment, they will still be white, with all the psychological and historical baggage this entails. Whiteness itself will therefore have to be deconstructed....
Identity politics in effect invites us to embrace racism, but to do so in the name of anti-racism.... Hence the fundamental contradiction of identity politics: it speaks of love, but fans the flames of hatred....
Adolph Reed: Identity Politics Is Neoliberalism, bennorton.com, June 29, 2015:
Political scientist and race theorist Adolph Reed has long maintained that identity politics is a form of neoliberalism. In a June article, he explains: [Identity] politics is not an alternative to class politics; it is a class politics, the politics of the left-wing of neoliberalism...
Reed condemns identity politics for, despite its putative good intentions, disguising objectively right-wing, neoliberal ideology with superficially “progressive” rhetorical window dressing...
Islamic Jihad: Symptom of a Western Cause, Raymond Ibrahim, PJ Media, December 16, 2015:
Yet it still remains unclear whether objective thinking will eventually overthrow the current narrative of relativism, anti-Westernism, and asinine emotionalism.
Simply put, celebrating multiculturalism and defeating the jihad is impossible.
The Delusions of Left-Wing Identity Politics, Jonal Goldberg, National Review, June 27, 2015:
...identity politics is fueled by generous subsidies from higher education, foundations, and other institutions designed to transfer resources to the Griping Industry. But if you spend enough time teaching people to think that way, guess what? They’ll think that way...
What’s Wrong With Identity Politics (and Intersectionality Theory)? A Response to Mark Fisher’s “Exiting the Vampire Castle” (And Its Critics), The North Star, Michael Rectenwald, December 2, 2013:
The problem with identity politics, then, is that it is one-sided and undialectical. It treats identities as static entities, and its methods only serve to further reify those categories. It aims to liberate identity groups (or members thereof) qua identity groups (or individuals), rather than aiming to liberate them from identity itself. Identity politics fails not because it begins with various subaltern groups and aims at their liberation, but because it ends with them and thus cannot deliver their liberation. It makes identities and their equality with other “privileged” groups the basis of political activity, rather than making the overcoming of the alienated identity, for themselves and all identity groups, the goal. The abolition of the one-sidedness of identity – as worker, woman, man, or what have you – represents real human emancipation. Always failing this, identity politics settles for mere linguistic emancipation...
Identity Politics Play a Role in US Elections, Jeffrey Young, Voice of America, June 20, 2012.
Donald Trump: Last Chance For Conservatism–Or First Sign Of White Identity Politics? Maybe Both, James Kirkpatrick, VDare, August 30, 2015.
Identity Politics: Fool Us Twice, Shame on Us, by Lloyd Marcus, American Thinker, October 3, 2014.
Anarchy Is Swallowing Up the Social Order, by E. Jeffrey Ludwig, March 3, 3018:
... The momentum toward anarchy began with the move toward federal government expansion. During Woodrow Wilson's presidency, we began to see the implementation of what is now called the administrative state. This was helped along by our participation in WWI, which created the need for more governmental controls. This was followed by the massive Keynesian demand-side economics implemented by Franklin D. Roosevelt, the New Deal, and WWII....
However, given the present size, scope, and cost of our government, it never seems to occur to them that governmental policies have been wrongheaded and guided by a wrong philosophy or purpose for the past 100 years. It's not the size and power of the government that has been lacking; rather, the size and power have been put in the service of the wrong purpose.
To use a term from Greek philosophy, the telos (purpose) of government has been misplaced. Instead of designing laws and methods to enhance the dignity and freedom of the individuals living in our society, the government has been designing projects that are (1) guided exclusively or primarily by utilitarian goals of the greatest good for the greatest number or (2) by socialistic goals that government expansion is the greatest good in itself or (3) by identity politics, where the good of identity collectives is more important than the good of individuals.
The above three purposes of government diverge from the founding values of the United States. Those values are based on government's existence to promote the well-being of the individuals living under that government, individuals as individuals, not members of a subgrouping according to sex, race, age, occupation, mental functioning, health, etc. ...
The true conservatives have it right. We need to go back to our Judeo-Christian moral roots based on biblical and natural law, and to checks and balances and federalism as understood by the Founders.
Identity Socialism - Herbert Marcuse’s toxic legacy, by Dinesh D'Souza, American Greatness, May 30, 2020:
... Socialism in America today has turned black against white, female against male, homosexual and transsexual against heterosexual, and illegals against legal immigrants and American citizens....
American socialism is concerned less with worker exploitation by the bourgeoisie and more with the race, gender and transgender grievances of identity politics. I call it identity socialism....
If Franklin D. Roosevelt were alive today, he would not recognize the modern Democratic Party he created. Nor would he recognize the progressivism and socialism that formed the ideological pillars of his party. For FDR, as for Marx, socialism was primarily a matter of class. It was the rich versus the poor...
... for identity socialists and for the Lleft more generally, blacks and Latinos are in, whites are out. Women are in, men are out. Gays, bisexuals, pansexuals and transsexuals, together with other, more exotic, types are in; heterosexuals are out. Illegals are in, native-born citizens are out...
To understand identity socialism, we must go back several decades and meet the man who figured out how to bring its various strands together, Herbert Marcuse...

Intersectionality - stacking levels of perceived discrimination
Black scholar Kimberlé Crenshaw coined the term in a 1989 essay which professes that feminist theory, antiracist politics, and antidiscrimination law do not address the overall experiences of black women, as they each focus on only a single factor. Merriam-Webster defines intersectionality as "the complex, cumulative manner in which the effects of different forms of discrimination combine, overlap, or intersect." Intersectional feminism identifies how multiple aspects of discrimination overlap with gender. In other words, multiple levels of discrimination "stack".
A June 15, 2019 New York Post article, Why young, left-wing radicals could help re-elect President Trump, points out that:
"Intersectionalism holds that all types of oppression in American society are linked to one another and that they 'stack': that is, they are exponentially worse for those who experience more categories of discrimination. As Black Lives Matter co-founder Alicia Garza tells Soave, 'I’m uniquely discriminated against. I uniquely experience oppression based on standing at the intersection of race and gender.'"
Intersectionality in modern politics
Intersectionality has become more than a feminist term. It now embodies cross-linking of all kinds of discrimination across all of society. This discrimination may be actual, perceived, or theoretical - that is, potential - discrimination.
In the chapter Intersectionality 101 from his 2019 book, Panic Attack: Young Radicals in the Age of Trump, Robby Soave writes:
A protest is successful only if it highlights the correct issues, includes the right people - people who check all the appropriate boxes - and is organized by a ruling coalition of the most oppressed. This is what intersectionality dictates.
Though the words intersectionality and inclusion sound like synonyms, they are actually in conflict with each other...
Intersectionality is the operating system for the modern left. Understanding what it means and where it comes from is essential for comprehending the current state of activism on college campuses, at protests in major cities, and elsewhere....
Meanwhile, intersectionality has become a ubiquitous force on college campuses, where young people are taught to perceive all social issues through the lens of interrelated oppression and to find more grievances to add to the pile....
Those who grasp the truth of intersectionality are said to be "woke," slang that describes someone who has awakened to the reality of their own privilege and adopted a progressive worldview....
The Post article states, "Because all types of discrimination - from racism to transphobia, from economic inequality to 'ableism' - are linked, an intersectional activist is expected to combat them with equal fervor." Thus, a gay rights activists would be expected to join a feminist activist and a black activist in protesting discrimination against illegal aliens. The Post article continues:
“I’m not necessarily criticizing the idea of intersectionalism. In a sense it’s kind of true,” Soave told The Post. But in practice, “it makes it hard to get people on board to advance a cause when you say, ‘We don’t want you unless you agree to fight all the oppressions.” Someone might agree about the need to fight racism but not be ready for all of the things the activist left demands, like boycotting Israel or accepting their ideas on transgender identity.”...
“It’s a tyranny of the most victimized,” Soave said. “The more categories of oppression you can claim, the more authority you have.”
Intersectionality is not objective
Intersectionality has been criticized as a system that relies on non-objective concepts which can not be empirically verified. Thus, it is an ideological concept rather than a sociological concept.
It also raises the question of degree and pervasiveness: are all women discriminated against? Are all blacks discriminated against? Are all gays and lesbians discriminated against? In other words, if someone is a member of all of these groups, but only encounter discrimination 10% of the time in each category, then their cumulative discrimination would be 30 percent, not 300 percent. 30 percent is indeed a significant number, but then again, what if that individual suffers no discrimination at all in the freest nation on earth? Are they expected to behave as if they are discriminated against 300 percent of the time?
Intersectionality is a technique used by progressive leftists to organize and motivate identify groups to activism. It effectively magnifies the apparent strength of activism on a given issue well beyond the number of those who are truly concerned with the issue.
As Soave writes:
"The spread of intersectionality poses some problems for the left, since the theory divides people as often as it unites them....
A hopelessly divided opposition movement that cannot resist cannibalizing itself over intersectionality-induced disagreements is not going to be very effective."
Leftism - a Hegelian spiral toward Marxism
Have you ever gotten into a policy discussion at work, and ended up compromising your position, supposedly for the good of the company? Then the next month, became engaged in the same discussion which again ended up compromising down from your first compromised position? Then in another month, the same thing?
That's a form of the Hegelian dialectic - a never-ending spiral of discussion and compromise toward the goal as defined by your opponent.
It works in politics, too. For over a generation, we have witnessed the Left's incessant push via a Hegelian spiral toward their end goal of Marxism, aptly framed as "the fundamental transformation of America."
It's tough for those trying to understand and counter Leftism, especially if they are not aware that they are engaged in a Hegelian spiral. That is, an endless series of compromises that result in never-ending incremental steps toward Leftist goals.
You can't understand the Left without understanding the Left's objective (Marxism) and the fundamental mechanism by which it is achieved (Hegelian dialectic). Over the course of a generation we have seen America fundamentally transformed into a nation that previous generations would not recognize. Yet we have been conditioned in incremental steps to think that it is normal.
Today, not only protest, but violence is considered to be sanctioned and normal in Democrat-controlled cities. Why the wanton violence? It's part of the Leftist agenda to totally destroy America, so that it can be rebuilt as a Marxist / socialist state.
The Left’s Strategy and Tactics To Transform America
 The report: "Re-Remembering the Mis-Remembered Left: The Left’s Strategy and Tactics To Transform America" is tremendously important. It exposes the Left in terms of warfare dynamics and allows us to understand the Left in their own terms. Indeed, the report emphasizes that this is the only way to understand the Left.
"Re-Remembering the Mis-Remembered Left: The Left’s Strategy and Tactics To Transform America" is authored by Stephen Coughlin and Richard Higgins, published February 2019. 353 pages. ISBN-10: 1733473106, ISBN-13: 978-1733473101. Available in print, free PDF, and audio. Print and PDF versions include quotes and pullouts in color.
The authors are immensely qualified: Stephen Coughlin, Esq.: is an attorney, decorated intelligence officer and noted specialist on Islamic law, ideology and related strategic information programs. Coughlin and Rich Higgins run Unconstrained Analytics a 501(c)3 dedicated to analysis of evidence unconstrained by preconceptions and biases.
If you want to understand the relentless driving of the Left towards Marxism, read the report: "Re-Remembering the Mis-Remembered Left: The Left’s Strategy and Tactics To Transform America".
Part 1 of the report succinctly covers Hegel, Marx, the Fabians, Marcuse, and the Frankfurt school. It's not a lengthy, boring, philosophy lesson, but rather an integrated explanation of the Left's framework.
Part 2 of the report covers the Maoist concept of political warfare, provides an example using the Colorado Democracy Alliance, and covers the Left's use of narratives.
The authors writing style is precise, yet informative, interesting, and engaging.
From the Executive Summary
Saying that “the Left moves dialectically, through time, on a trajectory” simply recognizes that the Left is a movement in history defined by its movement through history; that its backward trajectory defines its forward movement; and that failure to recognize this arc leads to error. It is for this reason that this assessment emphasizes historical events, conditions and movements that have defined the Left from the Hegelian dialectic, to Marx, to Wilson’s progressivism, to the early Frankfurt School, to Mao’s Long March, to Marcuse’s thoughts on tolerance, to political correctness.
This is how the Left should be understood. Hence, it would be a mistake to treat the historical elements of this assessment as little more than background material. Assessing the Left as if Hegel and Marx simply provide interesting historical context to today’s events is the failure to recognize that for the Left, Marx was yesterday and Hegel the day before...
Selected excerpts from the report's Key Findings:
• The political rhetoric driving American politics runs along well-trodden paths sustaining a political framework from a by-gone era incapable of coming to terms with the political movements threatening our constitutional system today.
• Constrained by this archaic rhetoric, mainstream and conservative players are outmaneuvered in an information battle-space they hardly perceive; responding to current threats in under-inclusive manners.
• The "otherism" strategy developed by Marxists to destroy America focuses on the systematic destruction of identity leading to the systematic disenfranchisement of Americans from America. It manipulates the issues of the “other”, yet it has nothing to do with the “other”. Rather, it forces a classic dialectical negation along Hegelian lines. This activity presents a clear and present danger that will succeed if not countered. As such, this analysis does not suggest that this is a way to understand the left, it argues that it is the only way to understand it; recognizing that it is 1) Marxist, and 2) dialectically driven.
• The dominant cultural narratives of our time can best be summarized by the saying; “Political correctness is the enforcement mechanism of the multicultural narrative that implements Neo-Marxist objectives.” It is through these narratives that the left drives policy.
• Narratives that conservative leaders neither control nor understand drive national policy. When Republican leaders shrink from Constitutional principles for fear of being accused of racism, sexism, homophobia, etc., they are subordinating those principles to neo-Marxist narratives designed for that purpose.
• By submitting to these narratives, establishment Republicans first become pliant, and then obedient to the Left, accommodating it... In this role, establishment Republicans become the defeat mechanism of the Left.
• A strategic understanding of the Left recognizes that it is dialectically driven. As such, the Left is a teleologically informed movement that executes through history and thought, along an arc, with a trajectory. It is Hegelian. It defines everything that “is” as fuel for “becoming” in a dialectical process that compels it to negate. — “Change” “Perpetual Revolution” — Analysis of the Left that does not account for the dialectic will fail.
• The critical theory of the Frankfurt School is classical Marxism dedicated to penetration and subversion that relies on Hegelian processes to achieve its objectives... It seeks the destruction of Western culture...
• Frankfurt School leader Herbert Marcuse concurred with the Gramsci Marxist plan to adopt a “long march through the institutions” strategy based on Mao’s “long march” political warfare strategy.
• The Left focuses on cultural and institutional power by communicating its ideological initiatives in terms of “values” while targeting the placement of cadre throughout the mass line so they can enable those “values” by converting them first to norms, then to policy, and finally to law.
Selected excerpts from the report

Critical theory is simply the relentless reduction of Western civilization through a systematic series of negations that applies the Hegelian dialectic in support of Marxist objectives understood in nihilist terms. (Page 63)
It is with this understanding of the mechanics of “Repressive Tolerance’s” dialectical aufheben that one can see that it is necessarily directed against America and the American way of life. Marcuse calls for subversion, undemocratic means, and the suspension of the First Amendment in furtherance of implementing a postmodern campaign of “otherisms” based on racism, discrimination, etc. When reading Frankfurt School materials, the “right” and “fascism” should be understood to mean anything that is either not from the left or is something about which “the Left” disagrees. (Page 69)
Note that aufheben means to cancel or put an end to. Thus, today's cancel culture.
Hence, the statement that “political correctness is the enforcement mechanism of postmodern narratives that implements cultural Marxism”, speaks directly to the negation engine Marcuse’s “Repressive Tolerance” put in motion that today culminates in hate speech narratives. Political correctness is a Neo-Marxist line of effort. It is also an existential threat. (Page 71)
... the Frankfurt School, from its beginning it has been a Marxist organization purely dedicated to the destruction of Western society through the ruthless application of Hegel’s dialectic to every line of effort at every level of execution. (Page 85)
This analysis affirms that the first understanding of the Left is one that recognizes that it IS a teleologically informed movement that executes through history and thought, along an arc, with a trajectory. (Page 90)
At the 2008 Democratic National Convention held in Denver, that chose Obama as the Democratic candidate, [Democracy Alliance founder Rod] Stein spoke of the need to consolidate counter-state activities in the state through the placement of committed personnel at the senior levels of the government in what has popularly come to be known as the “deep state”. (Page 103)
The Left adopts a strategy that leverages their mass line to harness ever increasing power over institutions, including corporations, the government, religion, and the media. It is through Mao’s concept of political warfare that institutions are co-opted and authoritarian power is wielded. For this reason, there is an immediate need to understand what the media calls the “deep state” as the Maoist counter-state. (Page 126)
The Republican establishment, because it chooses to operate inside the Left’s cultural framework when responding to mass line narratives, has become an asset to the Left’s overall effort. (Page 129)
It is in this context that establishment Republicans become the designated defeat mechanism of the Left because, having been elected to reverse the Left’s efforts with no intention of actually doing so, they become the agents responsible for demoralizing the base that elected them. (Page 141)
Read the report
The report states that "The Left cannot be understood outside the dialectical materialist core that defines it. The dialectic comes from Hegel, the materialism from Marx. The two cannot be disassociated from each other or from the Left."
If you want to see through the smokescreen of the Left, read the report: "Re-Remembering the Mis-Remembered Left: The Left’s Strategy and Tactics To Transform America".
References
The report contains 465 footnotes and references.
Appendix D of the report contains an extensive list of recommended reading material.
Hegel’s Dialectics, Stanford Encyclopedia of Philosophy, June 3, 2016
Video interview with Stephen Coughlin
Video interview with Stephen Coughlin, author of "Re-Remembering the Mis-Remembered Left: The Left’s Strategy and Tactics To Transform America". Dr. Jerome Corsi interviews Stephen Coughlin, Esq.: attorney, decorated intelligence officer and noted specialist on Islamic law, ideology and related strategic information programs.
"When associated with rising factional discord, the increased hostility from the Left resonates a violence that is becoming a clear and present danger."
The interview is also available as a podcast: Dr Corsi Interview 07-20-20: Stephen Coughlin - Understanding the ANTIFA & BLM Counter Revolutions. See CorsiNation for more books and interviews.
The Challenge of Marxism, by Yoram Hazony, Quillette, August 16, 2020. Review: The Marxist threat to liberalism, by Fred Elbel, 24 August 2020.
Liberalism, Progressivism, Leftism, by eugyppius, 20 May 2022.
Marxism - The Threat Within America

Marxism - The Threat Within America
Marxism has been tried numerous times throughout history, and every single time it has failed. Proponents blindly contend that each failure was because it wasn't a true implementation of Marxism, and next attempt will be successful.
Marxist ideology was embraced by Communist dictatorships over the last 100 years, including Communist China, The Soviet Union, Cuba, North Korea, and Vietnam. An estimated 100 million people died as a result of famine, forced labor, and executions. One billion were enslaved.
Karl Marx believed that class conflict would lead to revolt of the working class against the managerial class. This conflict - or revolution - would ultimately lead to a Utopian classless communist society in which economic, as well as social and cultural capital, are redistributed.
The Marxist threat within America
Marxist infiltration of America has been underway for one hundred years. It's pervasive and hard to recognize because it has been disguised as other social movements. Many Americans intuitively understand that America has been undergoing a fundamental transformation, but they don't understand what it is, or why it is taking place. This transformation ramped up during Obama years, and visibly peaked during the Biden regime.
Marx's principle of class conflict failed to take root in America because the success of Capitalism elevated the economic well-being of the working class. Marxists in America therefore focused on cultural transformation and societal change.
The term "long march through the institutions" was coined by Rudi Dutschke and has been attributed to Marxist Antonio Gramsci. It involved a sweeping attack on Western culture via media, the film industry, and especially universities. This attack on Western Culture was termed "Cultural Marxism".
A form of Marxist philosophy developed by The Frankfurt Schools is called Critical Theory. It's a way of disguising Cultural Marxism. This philosophy has resulted in manifestations of identity politics and political correctness, which have effectively divided the United States - as was intended.
At this point in time, the long march through the institutions has been strikingly successful. There is a tremendous amount of damage to undo.
A first step in undoing this damage is to clearly understand that Marxist revolution is the driving force behind America's social upheaval. As stated by David Horowitz:
Related
A brief overview of Marxism in America is presented in the article, Trump Win Ends A Century Of Cultural Marxism, by Laszlo, Time For Truth, 7 March 2025. A multi-part series by the same author describes Marxist infiltration of America in more detail:
The Enemy Within: Part 1. Marxist Infiltration of America
Our Turning Point: Either a Liberal or Progressive America
Cultural Marxism, Political Correctness, and Critical Theory
Identity Politics: squabbling factions
Intersectionality - stacking levels of perceived discrimination
Leftism - a Hegelian spiral toward Marxism
The Bill of Rights vs The 10 Planks of the Communist Manifesto


Multiculturalism vs. America
Unconstrained mass immigration is a subset of a much larger problem we face - that is, the battle for the future of our country and ultimately of Western Civilization.
In the article Defend America - Defeat Multiculturalism, The American Mind, April 23, 2019, Ryan P. Williams describes the importance of recognizing multiculturalism as an overarchinging regime which presents an existential threat to America. Selected excerpts follow:
Today, multiculturalism and its politics of identity pose an existential threat to the American political order comparable to slavery in the 1850s or communism during the Cold War. Once confined to graduate seminars and the ethnic "studies" departments at our nation's colleges and universities, multiculturalism is now the authoritative ideology reigning over higher education, our media and political establishments, legal system, and corporate boardrooms.
If we do not reverse multiculturalism's advance, it will continue to undermine our country and constitutionalism, destroying the possibility of a common good and a life of civic peace. Indeed, multiculturalism threatens to take down western civilization as whole.
By multiculturalism, we do not mean the mere presence of many cultures, races, or ethnic traditions, which are a fixture of modern American life and can be found across our states, communities, institutions, and private associations....
Multiculturalism, on the other hand, is not this benign tolerance of diverse traditions. Multiculturalism is a comprehensive ideology, demanding obeisance to a rigid system of justice, vices, and virtues. It boasts an intellectual tradition that guides its leadership and adherents in the policing of its boundaries and the maintenance of its categories. It keeps a running list of friends and enemies, a roster of praise, shame, and blame.
In short, multiculturalism is a worldview - a regime, in the classical sense; a political and cultural way of life all wrapped up in one. As an ideology, it stands for nearly the opposite of America's national motto. It seeks to divide and conquer Americans, making many groups out of one citizenry. The modern Left, accustomed to running the campuses according to the new social justice diktats of multiculturalism, now wants to run the world that way.
The threat multiculturalism presents to the American regime and our way of life is now urgent.
We have decided to use the term "multiculturalism" instead of "identity politics" or a similar term, because despite its limitations and current usage "multiculturalism" is more comprehensive. It is a new system of truth and justice that seeks to revolutionize and transform the American way. Identity politics is the coalitional strategy of multiculturalism and political correctness its enforcement arm....
The failure to apprehend fully and take seriously multiculturalism has also led many on the Right to misinterpret and underappreciate President Trump's virtues and his significance as a political phenomenon. Trump understands instinctually that multiculturalism (and its politics of identity and political correctness) is anti-American. He understands that the unity found in patriotism is the antidote to a politics of group identity that if left unchallenged will irreparably divide and balkanize the American citizenry and lead to disunion....
The American Right's failure to evaluate correctly President Trump, his political movement, and the nature of his opposition stems from a much deeper error. They cannot think prudentially....
There are few categorical rules in politics, but in a republic, public opinion is everything. Public rhetoric and political demonstration can shape the public mind decisively.
Much of the American Right, regrettably, does not think of politics in this way. They are enamored with process rather than substance and do not think comprehensively about the rhetoric of justice. They take too narrow a view of politics. Unless conservatives begin to think about politics as Lincoln did - comprehensively - they will lose to multiculturalism....
The modern multiculturalist Left is intent on proliferating divisions without concern for American unity, cohesion, and stability. The modern Right is confused about the threat to the union posed by this political strategy. We must change course, and soon....
Another article is worth reading in full: Our House Divided: Multiculturalism vs. America, Thomas D. Klingestein, The American Mind, October 31, 2018. Here are a few excerpts:
Many conservatives did not see that Trump had framed the 2016 election as a choice between two mutually exclusive regimes: multiculturalism and America. What I call “multiculturalism” includes “identity politics” and “political correctness.” If multiculturalism continues to worm its way into the public mind, it will ultimately destroy America....
I realize the term “multiculturalism” is somewhat dated, but I mean to freshen it up by using it in its most comprehensive sense—as a political philosophy. Multiculturalism conceives of society as a collection of cultural identity groups, each with its own worldview, all oppressed by white males, collectively existing within permeable national boundaries. Multiculturalism replaces American citizens with so-called “global citizens.” It carves “tribes” out of a society whose most extraordinary success has been their assimilation into one people. It makes education a political exercise in the liberation of an increasing number of “others,” and makes American history a collection of stories of white oppression, thereby dismantling our unifying, self-affirming narrative—without which no nation can long survive....
During the 2016 campaign, Trump exposed multiculturalism as the revolutionary movement it is. He showed us that multiculturalism, like slavery in the 1850’s, is an existential threat. Trump exposed this threat by standing up to it and its enforcement arm, political correctness. Indeed, he made it his business to kick political correctness in the groin on a regular basis. In countless variations of crassness, he said over and over exactly what political correctness prohibits one from saying: “America does not want cultural diversity; we have our culture, it’s exceptional, and we want to keep it that way.”...
Most conservatives did not see Trump in 2016 as a man defending America. This was in large part because they did not see that America was in need of defending....
... the impulse for electing Trump was patriotic, the defense of one’s own culture ...
... Multiculturalism, not Trumpism, is the revolution. Trump’s campaign, and its defense by his intellectual supporters, was not a call for a revolution but a call to stop a revolution. Trump’s intellectual supporters did not say things could not get worse; they said without a sharp change in course there was a good chance we shall never get back home again....
The core idea of each of these [Trump's] anti-P.C. blasts, when taken in aggregate, represent a commitment to America’s bourgeois culture, which is culturally “Judeo-Christian,” insists on having but one language and one set of laws, and values: among other things, loyalty, practical experience, self-reliance, and hard work....
Trump understands that “diversity is our greatest strength,” which is multiculturalism boiled down to an aphorism, is exactly backwards. America’s greatest strength is having transcended race, and the one major exception was very nearly our undoing. In light of this history, the history of the world (one “tribal” war after another), and the multicultural car wreck that is Europe today, to manufacture cultural diversity is nothing less than self-immolating idiocy. Trump might not put it in these words, but he gets it. The average American gets it too, because it is not very difficult to get: it is common sense....
Read the entire article in full: Our House Divided: Multiculturalism vs. America, by Thomas D. Klingenstein, The American Mind, October 31, 2018:
Google Censors the Claremont Institute, publishers of American Mind, Powerline, May 5, 2019. Also see: Algorithms of Suppression, by Ryan P. Williams, American Mind, May 5, 2019. Learn more about Media Bias, Censorship, and Corporate Political Correctness Run Amuck.
Here are excerpts from selected articles responding to Klingestein's article:
Trump vs. Libertarian-Multiculturalism, by R. R. Reno, The American Mind, April 8, 2019:
From openness to emptiness: Our bipartisan elite wants to replace America with a vapid utopia where anything goes....
Thomas Klingenstein labels this regime “multiculturalism.” That’s as good a label as any. It expresses a dream of porous borders, heroic affirmations of difference and diversity, limitless openness, and life without an authoritative center. The regime is not “left.” It is bipartisan. Addressing the United Nations after the fall of the Soviet Union, the reliable voice of the American establishment, George H. W. Bush, dismissed the antiquated world of partisan loves and consolidating loyalties. He intoned, “I see a world of open borders, open trade, and, most importantly, open minds.” Multiculturalism stands as an ideologically developed version of this bipartisan establishment consensus in favor of ever-greater openness....
Almost the entire conservative apparatus is now captive to a libertarian-inflected political correctness. It promises to protect free speech and (perhaps) religious freedom, but shrinks from any substantive positions on cultural issues....
Trump vs. the Multiculturalist Insurrection, by Conrad Black, The American Mind, April 8, 2019:
... In practice, in the United States, identity politics is the atomization of the entire vast and intricate demography of 325 million Americans into dozens of overlapping aggrieved sub-sets, each claiming discrimination. This is the fragmentation of society into victim associations: ethnicities, groups of minority sexual orientations, people with physical and mental handicaps, with career reversals—an ever-broadening range of bearers of attitudes and afflictions. All groups except straight adult white males are endlessly hunted and outed to be embraced as yet another wronged collectivity that American virtue requires to be highlighted, elevated, and compensated; all, of course, in exchange for their votes.
In this seething deconstruction of the ostensibly united American people, political correctness is the iron code of discipline. Every step of the march is a debunking of America, a shaming of its hypocrisy, presumption, and moral turpitude....
Multiculturalism is bad policy when large groups of immigrants decline to assimilate to their new country. Virtuous and sincere and successful immigration need not mean cultural deracination. But immigration requires a conscious, determined decision to assimilate to the society where the immigrant arrives....
Yet, as Klingenstein rightly objects, advocacy of this form of immigration has become the official policy of the Democrats, who have been demographically captured and have sold out, bag and baggage, to illegal Latino immigrants....
Video: Stephen K. Bannon's Keynote Address at the Western Petroleum Marketers Association in Las Vegas, March 11, 2019. Bannon explains the relevancy of Donald Trump in regaining America's future from the agenda of multiculturalism:
Neoconservatism - a Destructive Force
Most people typically think that Neoconservatives (Neocons) are a benign offshoot of the conservative movement. In actuality, there is a significant overlap of Neocon values and objectives with those of the globalist multicultural Left.
The following article explains the Neoconservative movement and how it threatens Western Civilization. Excerpts are included below:
Neoconservatism: A Secularized Globalist Vision Which Will Destroy Western Civilization, by Boyd D. Cathey, Lew Rockwell, 9 May 2024:
...it is necessary to understand the significant role and the complex history of the movement labeled "neoconservatism" as an intellectual determinant in contemporary America, with its roots in Marxism and in a secularized reimagining of Zionist-inflected universalism...
Trotsky, a secularized Jew, advanced a Marxist-Leninist position that would stress global proletarian revolution and a dictatorship of the proletariat based on working class self-emancipation...Trotsky advanced the theory of "permanent global revolution"...
The final breaking point for many of those Marxists who would within a few decades gain a foothold in the American conservative movement probably came with the rise of antisemitism under Stalin immediately before and after World War II in Russia...
Horrified and disillusioned by what they considered to be the perversion of the socialist revolution... These former Marxists soon began to be known as "neoconservatives,"...
More significantly they altered positions which had been associated with the older conservative movement, often termed "paleoconservatism," to mirror their own vision... By the late 1990s the neoconservatives had taken over most of the major conservative organs of opinion, journals, and think-tanks...
They believed that the promise of equality... had to be promoted at home and abroad, and American conservatives, they preached, must lead the efforts to achieve global democracy...
In reality, both the multicultural Left and the neoconservative Right share a basic commitment to certain ideas and expressions. Both use comparable phraseology - about "equality" and "democracy," "human rights" and "freedom," and the desirability of exporting and imposing "our democratic values," whether in Ukraine or elsewhere...
... insofar as they claim to represent conservatism or the Republican Party, their purported opposition to the leftward tsunami engulfing what is left of the American nation is mere window-dressing at best, and outright collaboration at worst, only enabling the deadly virus destroying our civilization.
Socialism, Democratic Socialism, and Social Democracy
Socialism
Norman Thomas, Socialist Party presidential candidate in 1940, 1944 and 1948, proclaimed that:
Socialism is defined by Merriam-Webster as "a system of society or group living in which there is no private property... a system or condition of society in which the means of production are owned and controlled by the state."
An additional definition is that Socialism is "a stage of society in Marxist theory transitional between capitalism and communism and distinguished by unequal distribution of goods and pay according to work done." The New Oxford American Dictionary similarly defines socialism as "(in Marxist theory) a transitional social state between the overthrow of capitalism and the realization of communism." There are many varieties of socialism. The dictionary notes that "The term 'socialism' has been used to describe positions as far apart as anarchism, Soviet state communism, and social democracy; however, it necessarily implies an opposition to the untrammeled workings of the economic market.The socialist parties that have arisen in most European countries from the late 19th century have generally tended toward social democracy."
Dictionary.com notes that "Some socialists tolerate capitalism, as long as the government maintains the dominant influence over the economy; others insist on an abolition of private enterprise. All communists are socialists, but not all socialists are communists."
Difference.com describes how capitalism and socialism are contrasted:
Capitalism and socialism are somewhat opposing schools of thought in economics. The central arguments in the socialism vs. capitalism debate are about economic equality and the role of government. Socialists believe economic inequality is bad for society, and the government is responsible for reducing it via programs that benefit the poor (e.g., free public education, free or subsidized healthcare, social security for the elderly, higher taxes on the rich). On the other hand, capitalists believe that the government does not use economic resources as efficiently as private enterprises do, and therefore society is better off with the free market determining economic winners and losers.
The U.S. is widely considered the bastion of capitalism, and large parts of Scandinavia and Western Europe are considered socialist democracies. However, the truth is every developed country has some programs that are socialist.
An extreme form of socialism is communism.
The article continues with a comparison chart listing key differences between capitalism and socialism.
Socialist political movement
Wikipedia has an excellent series on socialism, which differentiates between economic socialism as defined above and the socialist political movement, which is concerned with addressing social problems resulting from capitalism. Wikipedia observes that:
Social ownership may refer to forms of public, cooperative, or collective ownership; to citizen ownership of equity; or to any combination of these. Although there are many varieties of socialism and there is no single definition encapsulating all of them, social ownership is the common element shared by its various forms.
Socialism can be divided into both non-market and market forms. Non-market socialism involves the substitution of an economic mechanism based on engineering and technical criteria centered around calculation performed in-kind for factor markets, money and the accumulation of capital; therefore functioning according to different economic laws than those of capitalism. Non-market socialism aims to circumvent the inefficiencies and crises traditionally associated with the profit system. By contrast, market socialism retains the use of monetary prices and factor markets for the allocation of capital goods between socially-owned enterprises and, in some cases, the profit motive with respect to their operation...
The socialist political movement includes a diverse array of political philosophies that originated amid the revolutionary movements of the mid-to-late 1700s out of general concern for the social problems that were associated with capitalism. In addition to the debate over markets and planning, the varieties of socialism differ in their form of social ownership, how management is to be organized within productive institutions, and the role of the state in constructing socialism. Core dichotomies associated with these concerns include reformism versus revolutionary socialism, and state socialism versus libertarian socialism.
Democratic Socialism
Democratic socialism involves democratic control over the socialist means of economic production. In other words, economic socialism is implemented by politically democratic government control. Wikipedia notes that:
Democratic socialism is a political system wherein there is democratic control of a socialist economic system. It thus combines political democracy with social ownership of significant elements of the means of production. Sometimes used synonymously with "socialism", the adjective "democratic" is often added to distinguish itself from the Marxist-Leninist brand of socialism, which is widely viewed as being non-democratic.
Democratic socialism is distinguished from both the Soviet model of centralized socialism and from social democracy, where "social democracy" refers to support for political democracy, regulation of the capitalist economy, and a welfare state...
That is, whereas social democrats only seek to "humanize" capitalism through state intervention, democratic socialists see capitalism as inherently incompatible with the democratic values of liberty, equality and solidarity; and believe that the issues inherent to capitalism can only be solved by superseding private ownership with some form of social ownership.
Social Democracy
Social democracy focuses on socialist state intervention in order to further social justice, particularly in Europe. RationalWiki explains that:
Social democracy is the idea that the state needs to provide security and equality for its people and should actively reorder society in a way that is conducive to such developments, but that such changes should be brought about gradually, legitimated by a democratically-elected majority.
It is native to Europe, where social democrats regularly feature as one of the major parties and have led (or at least participated in) governments in most states at some point in time, most notably in Scandinavia (up to being nicknamed the "Nordic model"). Social democrats typically regard government intervention as a force for good, constraining markets and engaging in redistributive efforts for the benefit of the lower classes in order to establish a more equitable society.
Oxford Bibliographies notes that:
As a political theory, European social democracy has its origins in the development of the workers’ movement, inspired by Marxist and utopian socialist ideas, in the second half of the 19th century. This movement spawned political parties with the label “social democratic,” “socialist,” or “labor” in practically every European country...
Social democratic parties went on to establish themselves as mainstream political forces, participating in government or forming the main opposition, in almost every European country. Where social democrats were electorally successful, they were able to promote institutions such as the welfare state and corporatist bargaining in the workplace, and in some countries they brought parts of the private economy under government control.
Wikipedia describes social democracy:
Social democracy is a political ideology that supports economic and social interventions to promote social justice within the framework of a capitalist economy, and a policy regime involving collective bargaining arrangements, a commitment to representative democracy, measures for income redistribution, regulation of the economy in the general interest and welfare state provisions. Social democracy thus aims to create the conditions for capitalism to lead to greater democratic, egalitarian and solidaristic outcomes; and is often associated with the set of socioeconomic policies that became prominent in Northern and Western Europe—particularly the Nordic model in the Nordic countries—during the latter half of the 20th century.
Social democracy originated as a political ideology that advocated an evolutionary and peaceful transition from capitalism to socialism using established political processes in contrast to the revolutionary approach to transition associated with orthodox Marxism...
Modern social democracy is characterized by a commitment to policies aimed at curbing inequality, oppression of underprivileged groups, and poverty; including support for universally accessible public services like care for the elderly, child care, education, health care and workers' compensation. The social democratic movement also has strong connections with the labour movement and trade unions, and is supportive of collective bargaining rights for workers...
Related
Why the Great Reset Is Not 'Socialism', by Michael Anton, Compact, 30 November 2022.
Why Are Communists Determined to Destroy the US?, by Bruce Deitrick Price, American thinker, 18 December 2022.
Why Socialism Never Works: A Video Marathon.
Capitalism has lifted millions out of poverty and is the only creator of wealth. Socialism ONLY results in economic ruin. So why do so many young people today support it? Watch this specially-curated video marathon devoted to understanding Socialism and its pitfalls.

Transnational Progressives vs. Democratic Nationalists - Who Should Govern?
In the article: Ideologies Have Consequences - Transnational Progressives v Democratic Nationalists, Quadrant, February 27, 2016, author John Foote, explains that:
What might be called "transnational progressivism" is the ideology for an age once thought not to need one. President Obama, for example, was hailed as 'not a doctinaire liberal' and 'centrist and pragmatic'. The truth, as eight sorry years have shown, is very different...
Hoover Institution scholar Peter Berkowitz noted that, in fact, Obama does share similarities with the pragmatist philosophers in the sense that he is, as they were, a progressive ideologue promoting a decidedly ideological agenda (think John Dewey), while masquerading as a rational non-partisan “pragmatist” committed to “what works” rather than to a progressive utopian vision of the future...
Foot observes how modern politics has been fragmented into a quagmire of identity politics - groups competing for a share of the political power once considered the domain of mainstream America. He notes that this fragmentation has been dramatically advanced by the Obama Progressive administration:
Whether one examines national health care, immigration, racial and gender politics, LGBT rights, executive orders, aggressive “diversity” initiatives promoting “substantive equality” throughout the federal government in education, housing, energy, defence and elsewhere, judicial appointments, and foreign policy openings to Iran and Cuba—after seven years, it is clear that the current American President is the most ideological since Ronald Reagan. After all, the stated goal of the Obama administration is the “fundamental transformation of the United States of America”, which suggests neither a “centrist” nor “pragmatic” agenda.
Obama’s ideology is progressivism, an American branch of a global ideology that could be described as transnational progressivism or global progressivism. The American wing of progressivism (sometimes confusingly called liberalism) shares a broad worldview with the Western Left generally.
Foote describes how the ideology of transnational progressivism is strongly infused among Western elites...
At home, global progressives focus on promoting what they call “marginalised” groups, such as women, LGBT people, racial minorities, linguistic minorities, immigrants, particularly Muslims. For example, the Western Left calls for “gender parity” (imposed proportional representation) across the board in all institutions of civic life, by fiat if necessary (violating the tenets of a free society)...
These new (post-1960s) fault lines are based on ethnicity, race, gender, sexual orientation, immigration, language, religion, globalism and other issues that are even more divisive for national cohesion than traditional class struggle...
Abroad, Western Leftists promote (in varying degrees and where politically possible) what they call “global governance”, meaning the building of supranational institutions and policies that diminish the role of the nation-state, including the democratic nation-state. The ultimate goal of this grand ideological project is the creation of an increasingly integrated global order with laws and institutions that are superior to those of the nation-state...
Western progressives appear to approach external and internal politics with sharply different mindsets. International relations are viewed through the prism of “win-win”...
On the other hand, the progressives view domestic politics as strictly a zero-sum game. Their opponents at home, Western conservatives, are often excoriated as racists, xenophobes and reactionary retrogrades...
Foot notes that this ideological struggle highlights one of the most important political questions facing Western civilization: Who should govern?
First and foremost, in the West today, an intense ideological struggle is raging non-stop over the most momentous issues of world politics, including the singular, primary political question: Who should govern? The current migrant crisis and the ongoing issues of mass immigration, multiculturalism and cultural assimilation highlight this ideological conflict throughout Western politics.
Who decides immigration policy: democratic nation-states or hundreds of thousands or millions of migrants on their own? Who accommodates to whom: host nationals or newcomers? What principles determine policy: government by consent of the governed or evolving concepts of global human rights? If the latter, who decides what those universal human rights are?...
...principled democratic nationalists, whether Reaganite-Thatcherite or Gaullist, have more in common with each other than with their leftist opponents who emphasise identity politics...
What is at stake in determining refugee-immigration-assimilation policy (which must be seen as one interdependent issue) is the right of societal preservation and societal reproduction: Does a free people have the right to perpetuate its way of life or not?...
Do the French, British, Poles, Hungarians, Czechs, Americans and Australians have the right to decide for themselves whether or not to perpetuate their cultures, institutions and ways of life? Or will these questions be decided for them (and against their will) by transnational elites (through ideologically partisan interpretations of global human rights) and/or by millions of migrants from the developing world “voting with their feet” and arriving without the consent of the host nation’s citizens?...
Western civilization is at a turning point. The nation-state is under attack both from within via the Progressive agenda and from without via mass immigration and the trans-national corporatist agenda of globalist elites. The paramount question indeed is: Who should govern?
Related book
Sovereignty or Submission: Will Americans Rule Themselves or be Ruled by Others?, by John Fonte
ISBN-10: 1594035296, ISBN-13: 978-1594035296
Woke and Wokeism
The following 5-minute video gives an excellent definition and explanation of woke / wokeism / wokeness.
What is woke / wokeism / wokeness?
What is Woke? by Vivek Ramaswamy:
Here is Wokeism, according to Vivek, in a few sentences:
1) To be woke is to believe that there is "an invisible power structure" that has 'cis' White males at the top; your position in that power structure is set by your race, gender and sexual orientation.
2) Political, economic and cultural power must be targeted at correcting those "invisible societal injustices."
3) Begun as a "challenge to the system," Wokeism has now become the "system in America."
4) Wokeism has many deleterious effects:
a) To be woke is to reject "the idea of the individual having agency in their own lives"; instead, your race, gender and sexual orientation "determine who you are and what you can achieve."
b) A woke society is a fearful society: "A culture of fear" has "replaced our culture of free speech in America."
c) A merit standard for admittance, employment and promotion is rapidly being replaced by a victim standard.
d) People are increasingly divided: "We lose our ability to become one people": the "sacred places that can bind us together... the companies where we work, the churches where we worship, the universities where we learn" become a political bastion for advancing "this race and gender and sexual orientation-based view of the world." Thus "We lose those spaces where we otherwise used to come together":
There is a 5th deleterious effect - exclusively on whites. This is not from Vivek, but consistent with his ideas. It is inspired by Helen Andrews of the American Conservative:
e) Whites can look to a future as "permanently powerless scapegoats": America's great historical figures will increasingly be seen as "losers who had labored for a collapsed and discredited cause." Because of slavery Whites will have "no basis for making claims in the public sphere."
Helen Andrews is senior editor at the American Conservative. Extrapolating from the permanent guilt of White South Africans over Apartheid, Andrews sees the same future for American Whites over slavery. This is "what Black Lives Matter" and "The 1619 Project" have in mind for White Americans.
BLM and 1619 advocates embrace the moral certainty with which we condemn Jim Crow and extend it to everything White Americans have ever done until - like White South Africans - we will "feel grateful just to have our continuing presence tolerated."
White Americans can never look forward to a day when they are "no longer blamed for everything that goes wrong in their country." As slavery "recedes into the past, its role as a political explanation grows... every ANC [Democrat] politician blames lingering racial disparities on the legacy of racism."
"So white South Africans will never achieve any political power no matter how hard they try, and they will never cease to be blamed for the country's misfortunes. That is the very definition of a dead end... the most South African thing about our [America's] politics is the current effort to push White Americans into that same position as permanently powerless scapegoats."
Recent books by Vivek:
Woke, Inc.: Inside Corporate America's Social Justice Scam(2021)
Nation of Victims: Identity Politics, the Death of Merit, and the Path Back to Excellence (2022)
[The above section courtesy Tom Shuford]
Related
Recommended: Video: Best Explanation of Marxism
Cultural Marxism, Political Correctness, and Critical Theory
Identity Politics: squabbling factions
Intersectionality - stacking levels of perceived discrimination
Marxism Key To Understanding Leftists
Setting the record straight on slavery
On this day, Republican Party founded to oppose expansion of slavery
A Short History of Slavery video
The Alternative Right
A very good discussion of the alternative right is presented in the Breitbart article: An Establishment Conservative’s Guide To The Alt-Right, by Allum Bokhari & Milo Yiannopoulos, March 30, 2016. The authors describe the alt-right as an amorphous movement, young, and eager to commit secular heresies - the public enemy of beltway conservatives. The alternative right appeared on the scene in 2015 and speaks in youthful, taboo-jarring rhetoric.
Excerpts from the article follow, in which the authors reveal what the members of the alt-right stand for.
The Intellectuals
There are many things that separate the alternative right from old-school racist skinheads... The alternative right are a much smarter group of people - which perhaps suggests why the Left hates them so much. They’re dangerously bright...
The media empire of the modern-day alternative right coalesced around Richard Spencer during his editorship of Taki’s Magazine. In 2012, Spencer founded AlternativeRight.com, which would become a center of alt-right thought.
Alongside other nodes like Steve Sailer’s blog, VDARE and American Renaissance, AlternativeRight.com became a gathering point for an eclectic mix of renegades who objected to the established political consensus in some form or another. All of these websites have been accused of racism...
Steve Sailer, meanwhile, helped sparked the “human biodiversity” movement, a group of bloggers and researchers who strode eagerly into the minefield of scientific race differences — in a much less measured tone than former New York Times science editor Nicholas Wade...
...[LessWrong.com] began a gleeful demolition of the age-old biases of western political discourse. Liberalism, democracy and egalitarianism were all put under the microscope of the neoreactionaries, who found them wanting.
Liberal democracy, they argued, had no better a historical track record than monarchy, while egalitarianism flew in the face of every piece of research on hereditary intelligence...
Of course, it should be noted that accusation of racism is a form of an ad hominem attack - a formal debating tactic of attacking your opponent's character as opposed to answering their argument. It is a de facto admission of the inability to win the debate on the merits of one's argument alone.
Natural Conservatives
Natural conservatives can broadly be described as the group that the intellectuals above were writing for. They are mostly white, mostly male middle-American radicals, who are unapologetically embracing a new identity politics that prioritises the interests of their own demographic.
In their politics, these new conservatives are only following their natural instincts — the same instincts that motivate conservatives across the globe. These motivations have been painstakingly researched by social psychologist Jonathan Haidt, and an instinct keenly felt by a huge swathe of the political population: the conservative instinct.
Acclaimed social psychologist Jonathan Haidt described the conservative instinct in his 2012 book The Righteous Mind.
The conservative instinct, as described by Haidt, includes a preference for homogeneity over diversity, for stability over change, and for hierarchy and order over radical egalitarianism...
For natural conservatives, culture, not economic efficiency, is the paramount value. More specifically, they value the greatest cultural expressions of their tribe. Their perfect society does not necessarily produce a soaring GDP, but it does produce symphonies, basilicas and Old Masters. The natural conservative tendency within the alt-right points to these apotheoses of western European culture and declares them valuable and worth preserving and protecting...
...they doubt that full “integration” is ever possible. If it is, it won’t be successful in the “kumbaya” sense. Border walls are a much safer option...
It’s arguable that natural conservatives haven’t had real political representation for decades. Since the 1980s, establishment Republicans have obsessed over economics and foreign policy, fiercely defending the Reagan-Thatcher economic consensus at home and neoconservative interventionism abroad. In matters of culture and morality, the issues that natural conservatives really care about, all territory has been ceded to the Left, which now controls the academy, the entertainment industry and the press...
For decades, the concerns of those who cherish western culture have been openly ridiculed and dismissed as racist. The alt-right is the inevitable result. No matter how silly, irrational, tribal or even hateful the Establishment may think the alt-right’s concerns are, they can’t be ignored, because they aren’t going anywhere. As Haidt reminds us, their politics is a reflection of their natural inclinations.
In other words, the Left can’t language-police and name-call them away, which have for the last twenty years been the only progressive responses to dissent, and the Right can’t snobbishly dissociate itself from them and hope they go away either...
Millennials aren’t old enough to remember the Second World War or the horrors of the Holocaust... Racism, for them, is a monster under the bed... Millennials have trouble believing it’s actually real...
For decades – since the 1960s, in fact – the media and political establishment have held a consensus over what’s acceptable and unacceptable to discuss in polite society. The politics of identity, when it comes from women, LGBT people, blacks and other non-white, non-straight, non-male demographics is seen as acceptable — even when it descends into outright hatred.
Any discussion of white identity, or white interests, is seen as a heretical offence...
The pressure to self-censor must be almost overwhelming for straight white men - and, for most of them, it appears to be, which explains why so much of the alt-right operates anonymously...
The article points out that the alternative right is not going away and that we can no longer pretend that differences on free trade and health care represent the full gamut of the political spectrum.
Additional reading
A pretty good discussion of conservatism and immigration
I came across a pretty good discussion of conservatism and how immigration is the predominant conservative issue - if we don't constrain mass immigration, all of the other prized conservative values will pretty much fall by the wayside.
I think the article is a good read. It focuses mostly on the conflict of abstract conservative principles versus realistic fundamental interests. Here are some excerpts:
National Review’s Conservatism of Values, Ideas, and Principles, Kevin MacDonald, January 25, 2016:
The National Review assault on Donald Trump brings up the issue of basing one’s political views on values, ideas, and principles. The problem is simply that these abstractions may or may not reflect fundamental interests, and the Trump candidacy is bringing this to the fore. The NR commentary is essentially a brief for the priority of principles, ideas, and values over interests...
Concerns about “limited government” and respect for the Constitution are the main themes running through the comments. Trump just hasn’t been mouthing adherence to either of them, and his critics point to instances, mainly in the past, where he has strayed from these abstractions. (Yes, the Constitution is an abstraction, because as Joe Sobran said (and quoted by Gregory Hood), “the Constitution poses no serious threat to our form of government.”
In all of this, there is no mention of fundamental interests that might be compromised by adhering to the principles they espouse. As I noted in a recent article on the response to Trump, “Conservatism Inc. may argue that Trump is not a ‘conservative.’ But the reality is that Trump voters are focusing on his big issues—immigration first and foremost. Unless we win the immigration battle, none of the other battles can possibly be won.”
Immigration, more than any other issue, reflects fundamental interests in the ethnic composition of the United States. As an obvious example, limited government is not going to repatriate millions of illegal immigrants, or keep them out in the future. It is an enduring Utopian ideal that limited, constitutional government and individual freedom can survive importing millions of people from radically different cultures—cultures with no history of limited, constitutional government or individual freedom, and often with hatred toward the peoples and cultures of the West. Only the most reality-detached ideologue could believe that it’s all going to work out and something resembling traditional American institutions will be around in a few decades time if current trends continue.
As Jared Taylor points out, “Do they really believe that Mexicans and Haitians and Guatemalans and Vietnamese and Bangladeshis and Chinese are ever going to be made to care about the Second Amendment or Madisonian democracy or limited government?”...
This mindset among NR conservatives reflects a common defect among liberal Protestants that surfaced originally in the nineteenth century — the idea that the very different people crowding the shores of the U.S. would become “just like us.” These immigrants would eventually become good Protestants. What we are seeing now is how important segments of non-White immigrants, most obviously Muslims, are in fact unassimilable. They are never going to “become like us” and be concerned about the principles and values so near and dear to conservatives. It was the realization that so many of the post-1890 immigrants were infected with radical political beliefs that finally made Americans realize that immigrants don’t automatically turn into patriotic Americans. This realization was an important impetus for the 1924 immigration law...
... intellectual rationales for curtailing speech critical of the multicultural ideal are already common in the legal community in the U.S., while in Europe, police-state controls on thought and behavior intended to buttress the the multicultural revolution are firmly ensconced. For Germany reeling under the migrant onslaught, the first priority is to manage nativist anger, not restricting migration or repatriating migrants...
We have to understand that this way of thinking is the result of the counter-cultural revolution of the 1960s, the intellectual basis for which is discussed in The Culture of Critique. In CofC I discuss a paper by Roger Smith, who shows that until the triumph of the cultural pluralist model with the countercultural revolution of the 1960s, there were three competing models of American identity: the “liberal” individualist legacy of the Enlightenment based on “natural rights”; the “republican” ideal of a cohesive, socially homogeneous society; and the “ethnocultural” strand emphasizing the importance of Anglo-Saxon ethnicity in the development and preservation of American cultural forms. [1] These three strands are compatible with each other, but only if the US had retained its traditional homogeneous White underpinnings. Recall that the Immigration Restriction Act of 1924, with its built-in sense of White identity politics (i.e., biasing immigration to people from Northwest Europe), was essentially upheld over presidential veto not that long ago, in 1952. Yet these principled conservatives act as if their ideals have always been the guiding principles of the Republic. Fundamentally, they have plugged into the leftist zeitgeist in order to make themselves palatable to the powers that be...
The problem is that these self-described conservatives have thrown out all of this except the Enlightenment ideals. By denigrating and religiously avoiding the traditional ethnocultural strand of American identity as well as the republican ideal of a cohesive and socially homogeneous society, these “conservatives” have wholeheartedly gone along with this revolution. It is a revolution that amounts to the suicide of the West. In the end, it is anything but conservative...
If we are in fact seeing the beginning of a politics of more-or-less explicit White identity, the irrelevant cuckservatives at at the dying NR [National Review] must receive a great deal of the credit. And for that we can be thankful.
This article focuses on the importance of practical conservative interests over abstract principles. However, it doesn't focus on another component of so-called "conservatism": the donor class - wealthy and powerful elites who want an unending stream of cheap foreign labor to bolster the bottom line. It's well-known that "immigrants" vote Democratic and essentially Socialistic, which patently illustrates that the elitist agenda of dismantling America with mass immigration in no way represents either conservative interests or principles.
Related blog post and collection of articles
Conservatism, Inc's jihad against American conservatives, Fred Elbel, CAIRCO, January 26, 2016.
Movement Conservatism, Neoconservative orthodoxy, and Trump
A recent article on Unz Review sheds a lot of light on the current discord within the Republican Party. The article focuses on the two leading Republican candidates in a manner that includes a lot of perspective and historical context.
Here are some excerpts:
Why I Support Donald Trump and Not Ted Cruz, Boyd D. Cathey, Unz Review, January 27, 2016.
...I think it is important to begin with a review of some essential history, a brief exploration of the evolution of what is now called “Movement Conservatism” and its symbiotic relationship to the modern Republican Party. Understanding this background is critical to comprehending what has happened and is happening, politically and culturally, to what remains of the American republic in 2016. The transformation of the intellectual brain trust for the Republican Party has fundamentally affected and influenced the successive evolution of the positions the Republican Party has taken over the past fifty years.
Before discussing this history, I think it is necessary that we recall that the GOP Establishment, in fact, never gave up its virtual control of the party structure, despite Ronald Reagan...
It was my mentor and friend, the late Dr. Russell Kirk, whose volume The Conservative Mind actually initiated what became the older, scholarly “conservatism” in the 1950s. “Conservatism,” as Kirk explained it, encompassed an inherent distrust of liberal democracy, staunch opposition to egalitarianism, and an extreme reluctance to commit the United States to global “crusades” to impose American “values” on “unenlightened” countries around the world. Conservatives should celebrate local traditions, customs, and the inherited legacies of other peoples, and not attempt to destroy them. America, Kirk insisted, was not founded on a democratic, hegemonic ideology, but as an expression and continuation of European traditions and strong localist, familial and religious belief...
Beginning in the 1970s into the 1980s there was an influx of former Leftist and ex-Trotskyite intellectuals and writers, who had become anti-Communists and who began to move to the right into the older conservative movement. These were denominated the Neoconservatives, or Neocons. At first the Neocons were welcomed as ex-Marxists “coming in from the cold.” The problem was, and still is, that the Neocons brought with them not only their welcomed and spirited anti-Communism, but also their intellectual template of across-the-board egalitarianism, internationalism, and an a priori liberal and global interventionist foreign policy, which has, as its underlying principle, an almost chiliastic belief in imposed “liberal democracy” as the “final stage” of human (and secular) progress. And it is that Idea of (irreversible) Progress, which means the destruction of older traditions, customs, and those things considered “reactionary” that stand in the way of Progress, that characterizes most of Neocon thinking. Such ideas, needless to say, run counter to traditional conservative principles.
With strong academic connections and financial sources, the Neocons soon took control of most of the older conservative foundations, think tanks, and publications, and they did so with an iron hand, reminiscent of older days, when their Marxism was readily visible. And, more significantly, through this control of most “conservative” institutions, especially those centered in Washington, D. C., they very soon began to provide experts and advisors to the national Republican Party and its candidates. Their dominance manifested itself in organs such as the Ethics and Public Policy Center, the American Enterprise Institute (AEI), and in publications like Commentary, The Public Interest, and National Review (which shed its previous attachments to the older conservatism). The advent of the Rupert Murdoch media empire, with Fox News television, The Wall Street Journal, The Weekly Standard, and the New York Post as its notable voices, cemented this influence, which manifested itself abundantly in post-Reagan GOP policies and prescriptions...
Thus, in a very real sense, what is commonly termed “conservatism” today has not been truly conservative in the traditional sense for probably three or four decades, at least...
Trump, is not a “movement conservative,” that is, he is not a Republican candidate schooled in the narrative of Neoconservatism (while Marco Rubio wallows in it)...
Trump is the candidate who has been bold and farsighted enough to raise the real issues that are affecting every day Americans, not just “movement conservatives.” Most importantly, there is the supremely significant issue of illegal immigration. Consider, for example, what has happened to California, that up to the 1980s was considered a reliably “conservative” state, but after the 1986 Immigration Act, and three-to-four million new immigrants from Latin America, most illegal, will no longer ever vote for a Republican, much less any kind of conservative. The question is: do we want this to continue to happen? Who will be the candidate who will actually stop—and reverse—this?...
Then, there is the issue of Muslims coming to America. Trump’s plan to temporarily bar them coming in until a proper and secure screening system is put into place, is not only logical, it is completely constitutional and legal...
The case of Ted Cruz is mixed. He has on the Senate floor, opposed some of the measures pushed by the GOP Establishment, and he is not a member of the exclusive congressional “club,” but he is still part and parcel of the GOP/ Neocon “movement” fabric...
The essential question for me is this: as much as I might respect Ted Cruz’s senate career, I sincerely don’t think he would be able to withstand or take on the powerful Establishment in the same no-holds-barred and independent manner as the Donald. I don’t think Cruz would dislodge the Neocon intellectual stranglehold over the GOP policy; I think he would end up accepting and confirming it...
What is needed in this nation now is dramatic, even radical change. What is needed is not someone who will simply raise Hell, but someone who will be more like a bull loosed in a terrified china shop. Half measures and regular politicians, “mainstream conservatives” like Ted Cruz, I don’t think can pull it off. Trump, I believe, just maybe can...
Related articles
Conservatism, Inc's jihad against American conservatives
Media bias: Fox News Money Flows into Open Borders Group
The Bill of Rights vs The 10 Planks of the Communist Manifesto
The Bill of Rights is the first 10 Amendments to the Constitution. It specifies that “the enumeration in the Constitution, of certain rights, shall not be construed to deny or disparage others retained by the people.” It sets rules for due process of law and reserves all powers not delegated to the Federal Government to the people or the States. It spells out Americans’ rights in relation to their government. It guarantees civil rights and liberties to the individual, including freedom of speech, press, and religion.
Here is a summary of the first 10 Amendments to the United States Constitution, contrasted with a summary of the 10 Planks of the Communist Manifesto. Which more accurately portrays America at this point in time? In which direction is America moving?
The Ten Planks of the Communist Manifesto, by Karl Heinrich Marx, 1848. From Laissez-Fair Republic.
1. Abolition of Property in Land and Application of all Rents of Land to Public Purpose.
The courts have interpreted the 14th Amendment of the U.S. Constitution (1868) to give the government far more "eminent domain" power than was originally intended.
2. A Heavy Progressive or Graduated Income Tax.
The 16th Amendment of the U.S. Constitution, 1913 (which some scholars maintain was never properly ratified), and various State income taxes, established this major Marxist coup in the United States many decades ago.
3. Abolition of All Rights of Inheritance.
4. Confiscation of the Property of All Emigrants and Rebels.
We call it government seizures, tax liens, "forfeiture"
5. Centralization of credit in the hands of the state, by means of a national bank with state capital and an exclusive monopoly.
The Federal Reserve System, created by the Federal Reserve Act of Congress in 1913, is indeed such a "national bank"...
6. Centralization of the means of communication and transportation in the hands of the state.
In the U.S., communication and transportation are controlled and regulated by the Federal Communications Commission (FCC) established by the Communications Act of 1934 and the Department of Transportation and the Interstate Commerce Commission (established by Congress in 1887), and the Federal Aviation Administration as well as Executive orders 11490, 10999...
7. Extension of Factories and Instruments of Production Owned by the State, the Bringing Into Cultivation of Waste Lands, and the Improvement of the Soil Generally in Accordance with a Common Plan.
While the U.S. does not have vast "collective farms" (which failed so miserably in the Soviet Union), we nevertheless do have a significant degree of government involvement in agriculture in the form of price support subsidies and acreage alotments and land-use controls....
8. Equal Liability of All to Labor. Establishment of Industrial Armies, Especially for Agriculture.
We call it the Social Security Administration and The Department of Labor...
9. Combination of Agriculture with Manufacturing Industries; Gradual Abolition of the Distinction Between Town and Country by a More Equable Distribution of the Population over the Country.
10. Free Education for All Children in Public Schools. Abolition of Children's Factory Labor in it's Present Form. Combination of Education with Industrial Production.
People are being taxed to support what we call 'public' schools...
The Bill of Rights: What Does it Say? from National Archives.
The First Amendment provides several rights protections: to express ideas through speech and the press, to assemble or gather with a group to protest or for other reasons, and to ask the government to fix problems. It also protects the right to religious beliefs and practices. It prevents the government from creating or favoring a religion.
The Second Amendment protects the right to keep and bear arms.
The Third Amendment prevents government from forcing homeowners to allow soldiers to use their homes. Before the Revolutionary War, laws gave British soldiers the right to take over private homes.
The Fourth Amendment bars the government from unreasonable search and seizure of an individual or their private property.
The Fifth Amendment provides several protections for people accused of crimes. It states that serious criminal charges must be started by a grand jury. A person cannot be tried twice for the same offense (double jeopardy) or have property taken away without just compensation. People have the right against self-incrimination and cannot be imprisoned without due process of law (fair procedures and trials.)
The Sixth Amendment provides additional protections to people accused of crimes, such as the right to a speedy and public trial, trial by an impartial jury in criminal cases, and to be informed of criminal charges. Witnesses must face the accused, and the accused is allowed his or her own witnesses and to be represented by a lawyer.
The Seventh Amendment extends the right to a jury trial in Federal civil cases.
The Eighth Amendment bars excessive bail and fines and cruel and unusual punishment.
The Ninth Amendment states that listing specific rights in the Constitution does not mean that people do not have other rights that have not been spelled out.
The Tenth Amendment says that the Federal Government only has those powers delegated in the Constitution. If it isn’t listed, it belongs to the states or to the people.
Why Socialism Never Works: A Video Marathon.
Capitalism has lifted millions out of poverty and is the only creator of wealth. Socialism ONLY results in economic ruin. So why do so many young people today support it? Watch this specially-curated video marathon devoted to understanding Socialism and its pitfalls.
Which Doomer Are You? A New Political Map
Dave Pollard has been clanging to doom bell for a while. He made a 'new political map' in 2015—back when I would have called him crazy—but now I’m crazy too. When the world goes mad, only a madman stays the same.I have modified Pollard’s map above. Nothing wrong with the old design, this is just how I understood it.
The most interesting thing about Pollard’s map is how exploded it is. Everything we consider politics as usual is confined to one corner and called Deniers. It’s as if someone took the X and Y axis that bounds normal political thought and wrenched it apart....
Related
More from Indrajit Samarajiva.
Video highlights archive
Here is an archive of videos that have been highlighted on the CAIRCO home page. Also see: catalog of all articles with videos and immigration / population videos.
Please ignore forced youtube ads. The purpose of these videos is not to promote commercial interests. Various browser addons, such as uBlock Origin, can block ads.


 - Instant Runoff Voting explained")


Videos on the impact of mass immigration and population growth
Here are selected videos on mass immigration. These short videos focus on the tremendous impact mass immigration is having on the United States - an impact that America's children of all races, creeds, and colors will have to bear.
You can also view all articles tagged with video - this will present a list of articles containing video or linking to video.

Human Population Through Time
Video by the American Museum of Natural History. It took 200,000 years for our human population to reach 1 billion—and only 200 years to reach 7 billion. But growth has begun slowing, as women have fewer babies on average. When will our global population peak? And how can we minimize our impact on Earth’s resources, even as we approach 11 billion?
Immigration, World Poverty and Gumballs
Immigration - Global humanitarian reasons for current U.S. immigration are tested in this updated version of immigration author and journalist Roy Beck's colorful presentation of data from the World Bank and U.S. Census Bureau. The 1996 version of this immigration gumballs presentation has been one of the most viewed immigration policy presentations on the internet.
Immigration by the Numbers - Off the Charts
Change the Numbers
"Change the Numbers" is an excellent two-minute educational video from NumbersUSA on how Congress is using mass immigration to drive up United States population.
The video also has an interactive mode where you can set your own immigration numbers in order to observe the resulting impact on US population. Watch the video.
 .
. 
The high cost of illegal immigration
Illegal immigration costs the U.S. over $100 billion dollars a year. This video from the Federation for American Immigration Reform lays out the reasons why illegal immigration costs Americans billions in taxes.
They Come to America
"The film focuses on the human and financial costs of illegal immigration. We filmed over the span of 14-months (Oct 2010 - Nov 2011) and journeyed through many states including but not limited to Arizona, Illinois, Florida, DC, New York and Colorado. The debates, events, people, and places we captured on film is simply amazing. When it comes to the topic of illegal immigration, this is a first-of-its-kind film." - Filmmaker Dennis Michael Lynch. See more information. Watch the documentary.
Remember 1986 - the 1986 amnesty debate revisited
This 8 minute video takes a trip 27 years into the past to the 1986 "one time" amnesty debate where we find that the same arguments for legalization that were made in 1986 are being made today. It's deju-vu all over again.
They Come to America II

Immigration 'reform' adds 33 million competitors to jobless Americans
20 million Americans want a full-time job but cannot find one. This disenfranchised population is disproportionately less educated (no college), disabled, veterans and Black and Hispanic Americans).
More than a thousand lobbyists for corporate special interests are pushing legislation to keep the U.S. labor market loose and to lower the wages of most U.S. workers, both foreign-born and U.S.-born.
You can also view all CAIRCO articles tagged with video - this will present a list of articles containing video or linking to video.
Voter identification laws by state
BallotPedia has extensive information on voter identification laws by state, including an interactive map.